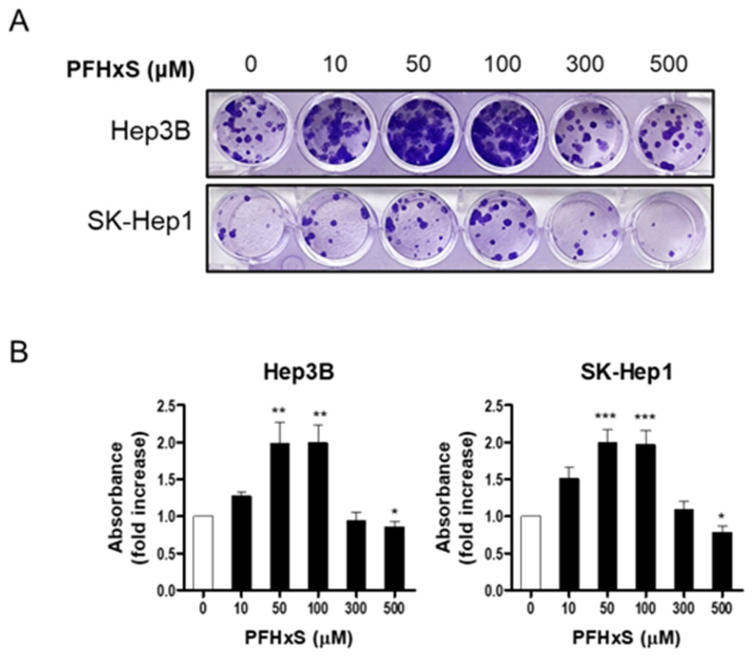
Figure 2.
The effects of PFHxS on colony formation of HCC and LSEC. Hep3B and SK-Hep1 cells were treated with the indicated concentrations of PFHxS for 12–14 days. The colonies were stained with crystal violet and representative photos of the colonies are presented (A). The absorbance of resolved dyes was measured at 570 nm (B). Data represent the mean ± SEM (n = 6–12; * p < 0.05, ** p < 0.01 and *** p < 0.001 vs. control).

