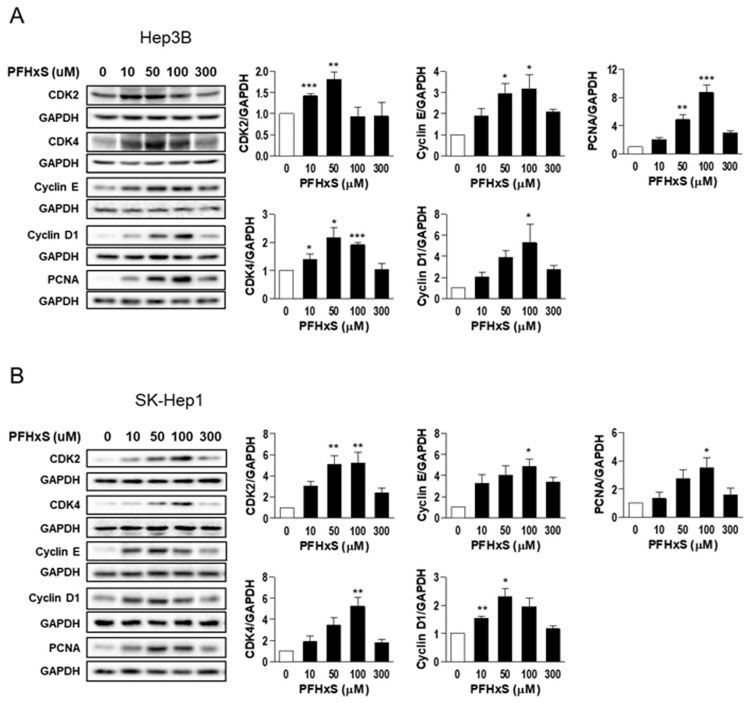
Figure 3.
The effects of PFHxS on cell-cycle signaling molecules in HCC and LSEC. Hep3B (A) and SK-Hep1 (B) cells were treated with the indicated concentrations of PFHxS for 48 h. The protein levels of CDKs, cyclins, and PCNA were detected by Western blotting. The band intensities were measured and presented in the bar graphs. Data represent the mean ± SEM (n = 3) (* p < 0.05, ** p < 0.01 and *** p < 0.001 vs. control).

