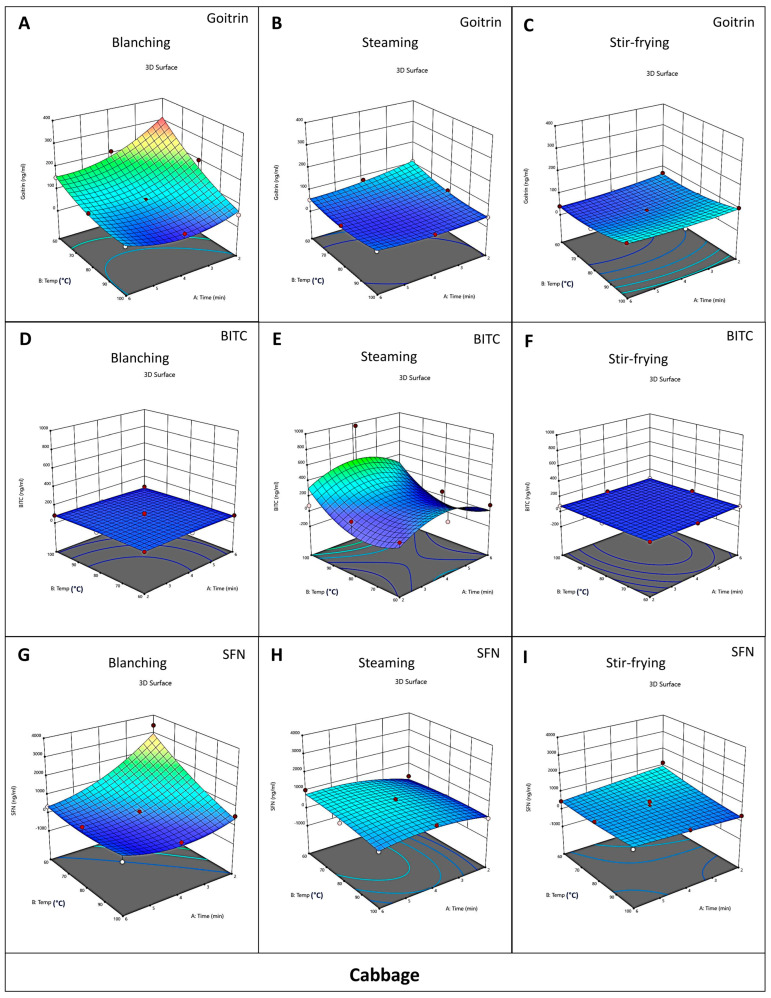
Figure 3.
Relationship between cooking factors in cabbage. Three-dimensional (3D) response surface methodology (RSM) diagrams show concentrations of goitrin (A–C), BITC (D–F), and SFN (G–I) in different cooking conditions of cabbage as the function of cooking time, cooking temperature, and cooking methods. Red, yellow, green, and blue areas depict the highest to lowest goitrin, BITC, and SFN concentrations.

