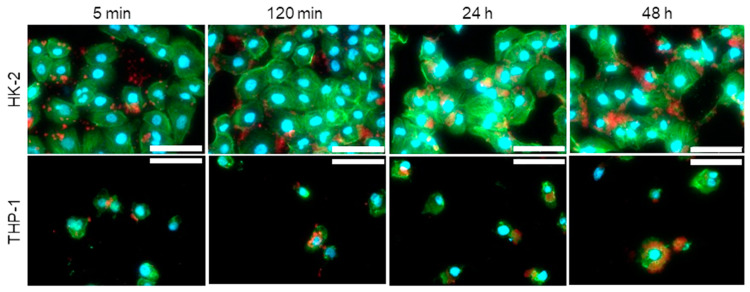
Figure 6.
Fluorescent micrographs of internalization of ION@UPy-NH2 by HK-2 and THP-1 cells after 5 min, 120 min, 24 h, and 48 h. The ION@UPy-NH2 were labeled with 0.025 g L−1 UPy-Cy5 (red, Figure S1), and the nuclei (DAPI) and cell skeleton (Phalloidin Alexa 488) of the cells were stained blue and green, respectively. Scale bars represent 30 µm. All samples were examined under the same settings.

