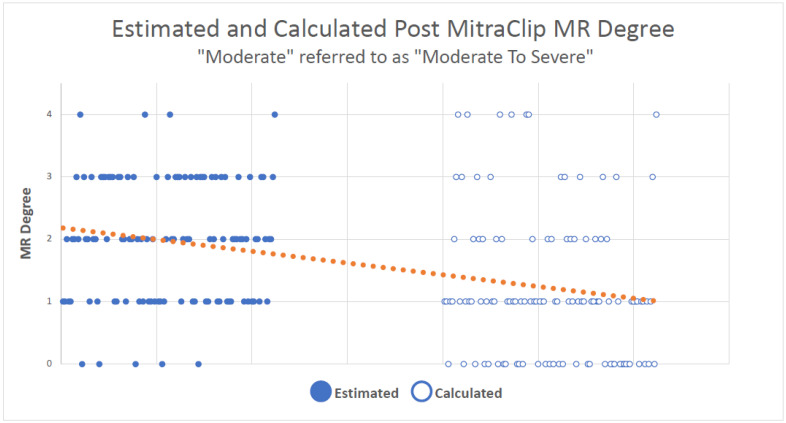
Figure 4.
The trend when comparing both methods with “moderate” group processed as “moderate to severe”. Each dot represents a patient in the study. Full dots represent the grade according to the estimation method and the blank dots represent the grade according to the calculation. The linear graph shows the overall trend of lowering the grade.

