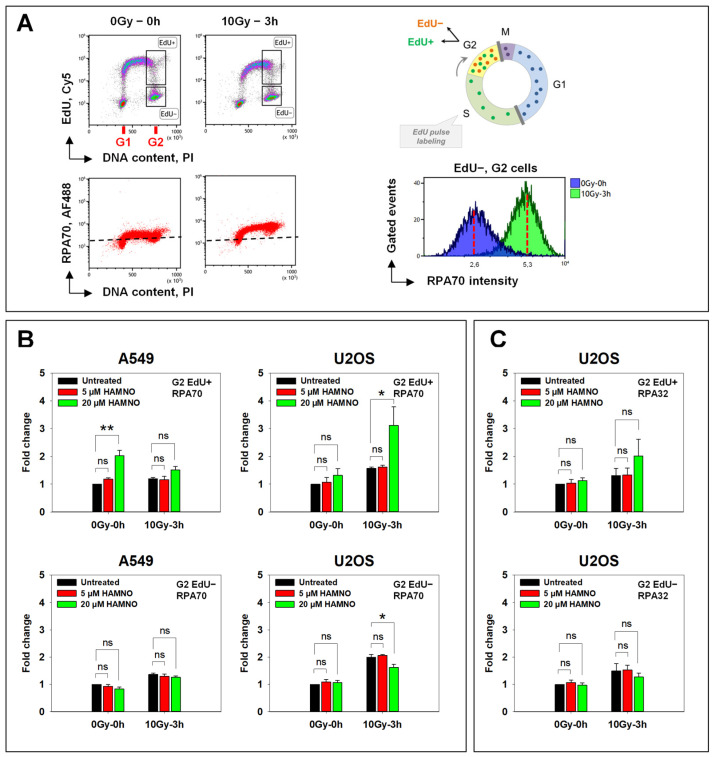
Figure 5.
Impact of RPA inhibitor HAMNO on RPA association with chromatin. (A) Left: Flow cytometry density plots of U2OS cells based on DNA dye PI, EdU labeled with far-red fluorescent Cy5 azide via the Click-iT reaction and chromatin-bound RPA70 labeled with primary monoclonal anti-RPA70 antibody followed by Alexa Fluor 488-conjugated secondary antibody. Gates are set to define cell populations of interest. Right: Representative histogram showing RPA70 signal in nonirradiated versus irradiated G2-phase cells. (B) RPA70 signal intensity in A549 and U2OS cells irradiated in the S- (EdU+) or G2-phase (EdU−). (C) RPA32 signal intensity in U2OS cells sustaining DNA damage in the S- (EdU+) or G2-phase (EdU−). RPA intensities in (B,C) are represented as fold change with respect to the untreated nonirradiated control at 0 h. Data are compiled from at least two independent experiments (±SD). Statistical significance was determined by one-way ANOVA and Holm–Sidak post hoc tests (* p < 0.05, ** p < 0.01, ns (not significant)).

