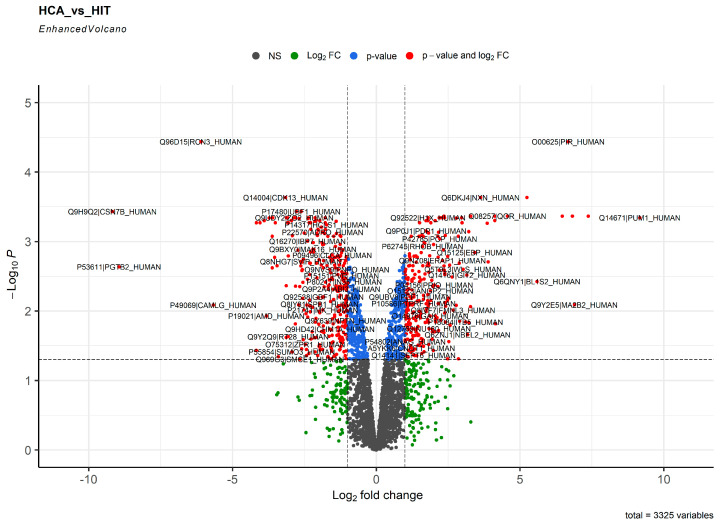
Figure 1.
Volcano plot showing the distribution of proteins in the proteome of human coronary artery endothelial cells (HCAECs) and human internal thoracic artery endothelial cells (HITAECs). Gray points depict the proteins with log2 fold change < 1 and FDR-corrected p value > 0.05. Green points depict the proteins with log2 fold change > 1 and FDR-corrected p value > 0.05. Blue points depict the proteins with log2 fold change < 1 and FDR-corrected p value < 0.05. Red points depict the proteins with log2 fold change > 1 and FDR-corrected p value < 0.05 (DEPs).

