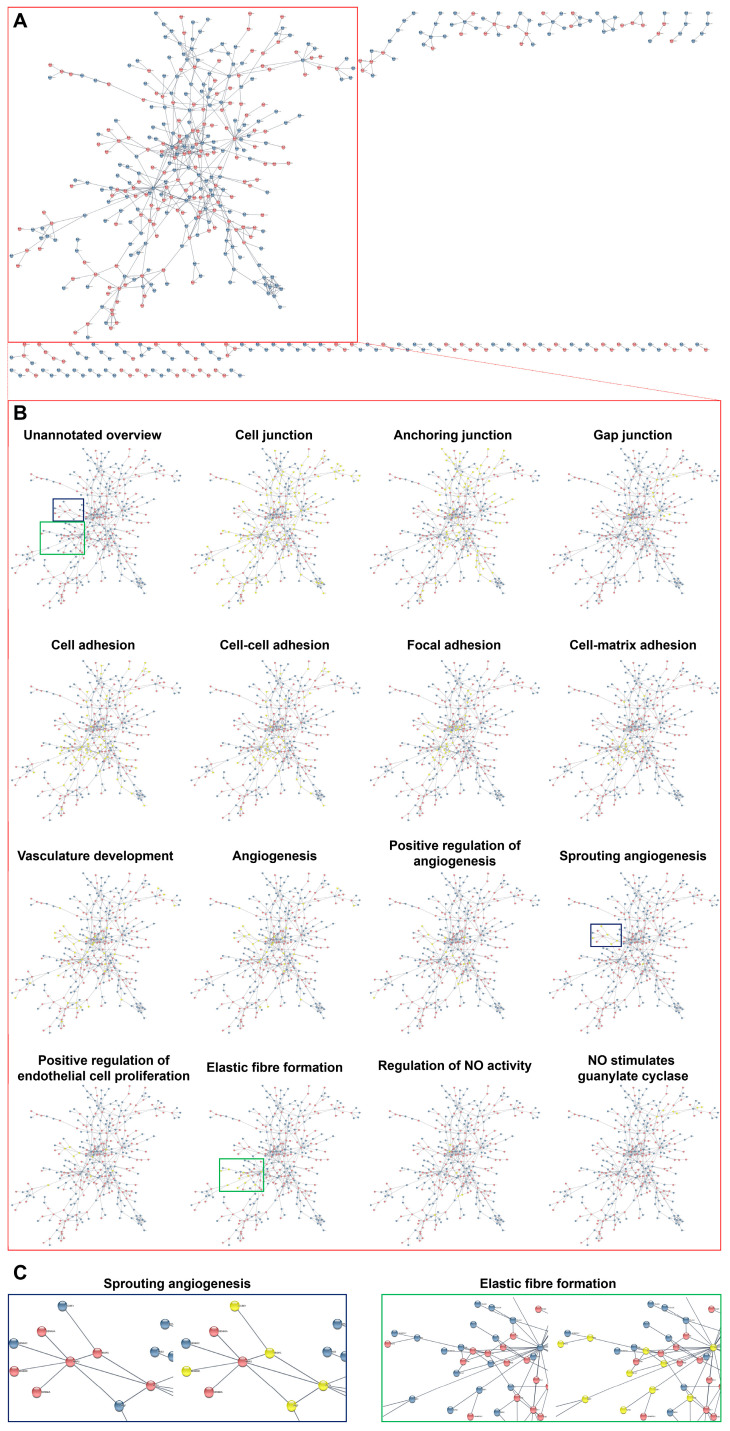
Figure 6.
Bioinformatic analysis of gene–gene interactions between primary human coronary endothelial cells (HCAECs) and human internal thoracic artery endothelial cells (HITAECs) cultured under laminar flow. (A) Overview of gene–gene interactions between HCAECs (blue colour) and HITAECs (red colour) cultured under laminar flow; (B) annotation of the interacting genes related to the specific molecular terms (yellow colour) in comparison with unannotated overview (the main cluster of interacting genes is demarcated by red contour); and (C) annotations of clustered interacting genes in selected molecular terms: sprouting angiogenesis (demarcated by blue contour) and elastic fiber formation (demarcated by green contour).

