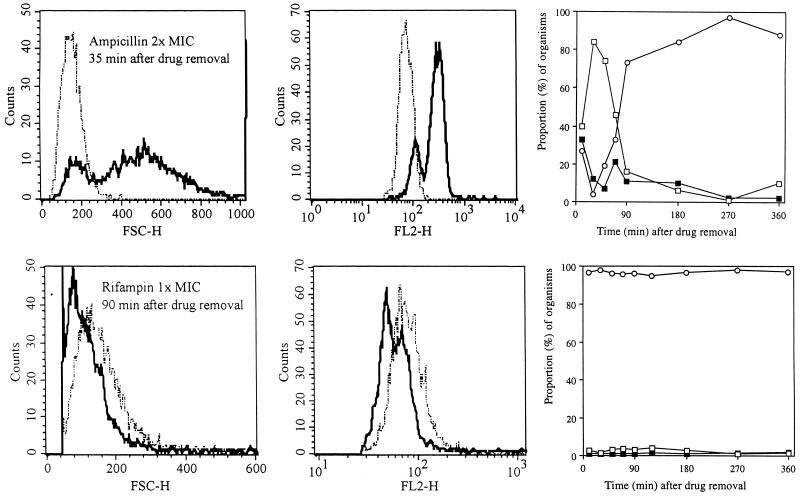
FIG. 3.
Histograms showing a comparison of the size distribution (FSC-H) (left panels) and nucleic acid content (FL2-H) (middle panels) of E. coli during the PAE after exposure to ampicillin at a concentration equivalent to twice the MIC at 35 min after drug removal and after exposure to rifampin at a concentration equivalent to the MIC (lower panels) at 90 min after drug removal. Dotted-and-dashed lines, control organisms; solid lines, organisms previously exposed to the antibiotics. (Upper right graph) Progressive changes in size, compared to sizes of control organisms, as a function of time after previous exposure to ampicillin. (Lower right graph) Summary of the minimal changes in size that were noted after previous exposure to rifampin. The sizes of the antibiotic-treated organisms were compared to three size intervals derived from the control, which are described in text and shown in Fig. 2. Open circles, bacteria in the PAE phase which were within 2 SDs of control size; solid squares, bacteria within 2 to 4 SDs; open squares, organisms >4 SDs from the control distribution.

