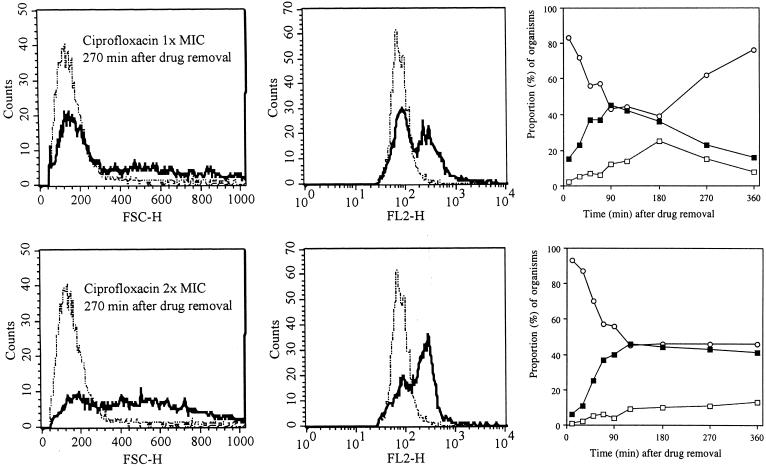
FIG. 4.
Histograms showing a comparison of the size distributions (FSC-H; left panels) and nucleic acid contents (FL2-H; middle panels) of E. coli during the PAE after exposure to ciprofloxacin at a concentration equivalent to the MIC and at a concentration equivalent to twice the MIC at 270 min after drug removal. Dotted-and-dashed lines, control organisms; solid lines, bacteria previously exposed to ciprofloxacin. Graphs (right panels) show progressive changes in size compared to sizes of controls. The sizes of antibiotic-treated organisms were compared to three control size intervals described in the text and shown in Fig. 2. Open circles, bacteria within 2 SDs of control size; solid squares, bacteria within 2 to 4 SDs; open squares, organisms >4 SDs from the control distribution.

