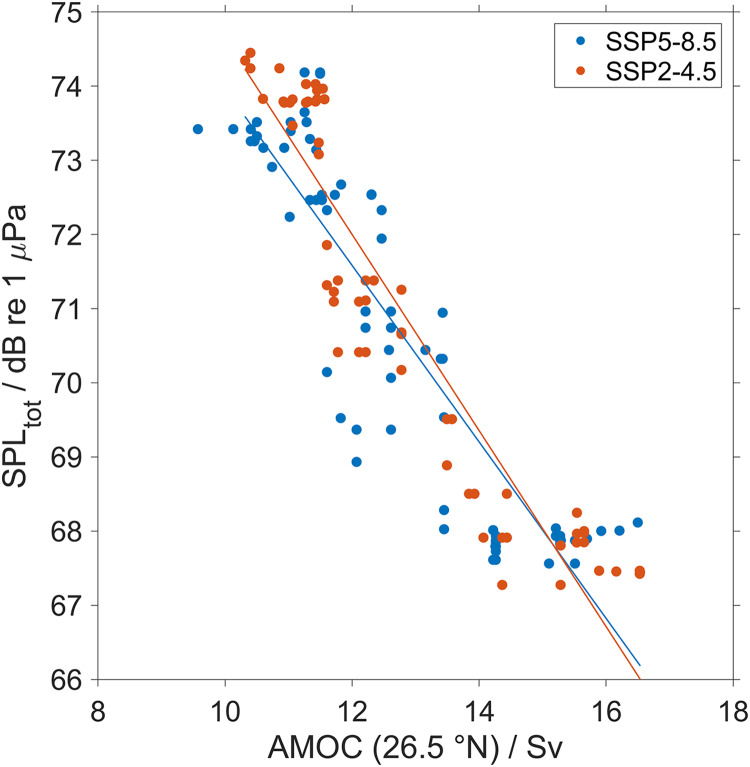
Figure 15. Correlation between Atlantic Meridional Overturning Circulation (AMOC) strength and the sound pressure level in the top 200 m.
Volumetric flow rate in Sverdrup of the Atlantic Meridional Overturning Circulation (AMOC) derived in the CESM2 using CMIP6 climate models for two different climate scenarios SSP5-8.5 (in blue) and SSP2-4.5 (in red) at 26.5° N smoothed using a 5-year moving median vs top 200 m median of the predicted SPLtot between 475 and 500 km distance for the Northwest Atlantic Ocean (45° N 40° W) from a single bulker. The regression equations are: for SSP5-8.5: SPLtot (dB re 1 μPa) = −1.2 ± 0.1AMOC + 85.7 ± 0.8 (R2 = 0.8) and for SSP2-4.5: SPLtot (dB re 1 μPa) = −1.2 ± 0.1AMOC + 87.9 ± 0.8 (R2 = 0.87).

