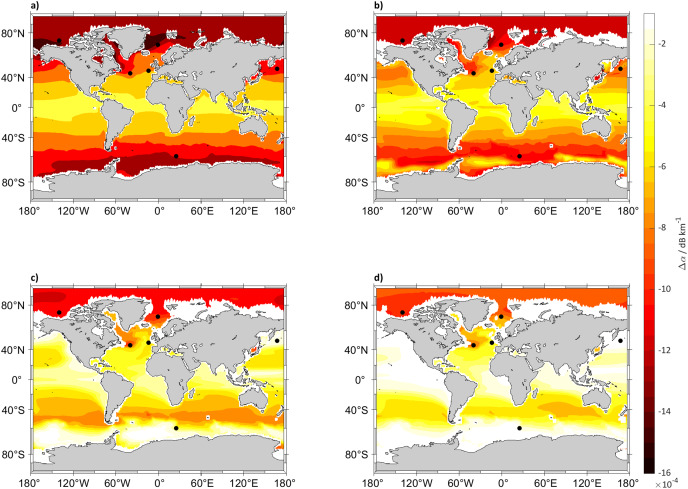
Figure 4. Absorption difference between (2018 to 2022) and (2094 to 2098) for SSP5-8.5.
Maps of the difference in 5 years mean of sound absorption (α) in dB km−1 in (2094 to 2098) and (2018 to 2022), calculated using van Moll, Ainslie & van Vossen (2009) algorithm at (A) 5, (B) 125, (C) 300 and (D) 640 m depth calculated for SSP5-8.5. The black dots indicate the sound source locations.

