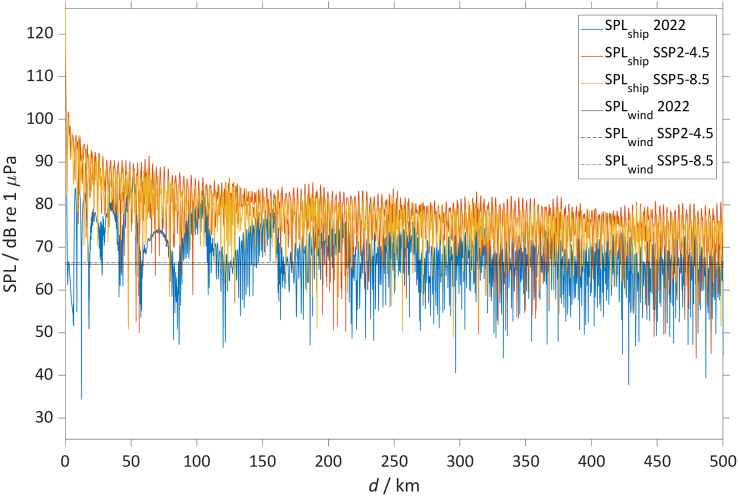
Figure 8. The sound pressure level from the bulker and wind.
The figure shows for the Northwest Atlantic Ocean (45° N 40° W) the SPL from the bulker (SPLship) and from the wind (SPLwind) at a single depth (50 m) for (2018 to 2022) (red), (2094 to 2098) for SSP2-4.5 (red) and SSP5-8.5 (yellow). The SPLship was calculated as the difference between the source level (SL) and the propagation loss (PL) derived using a parabolic equation model. The plot shows the SPLwind in black for (2018 to 2022) (continuous line), (2094 to 2099) SSP2-4.5 (dotted line) and SSP5-8.5 (dash-dotted line).

