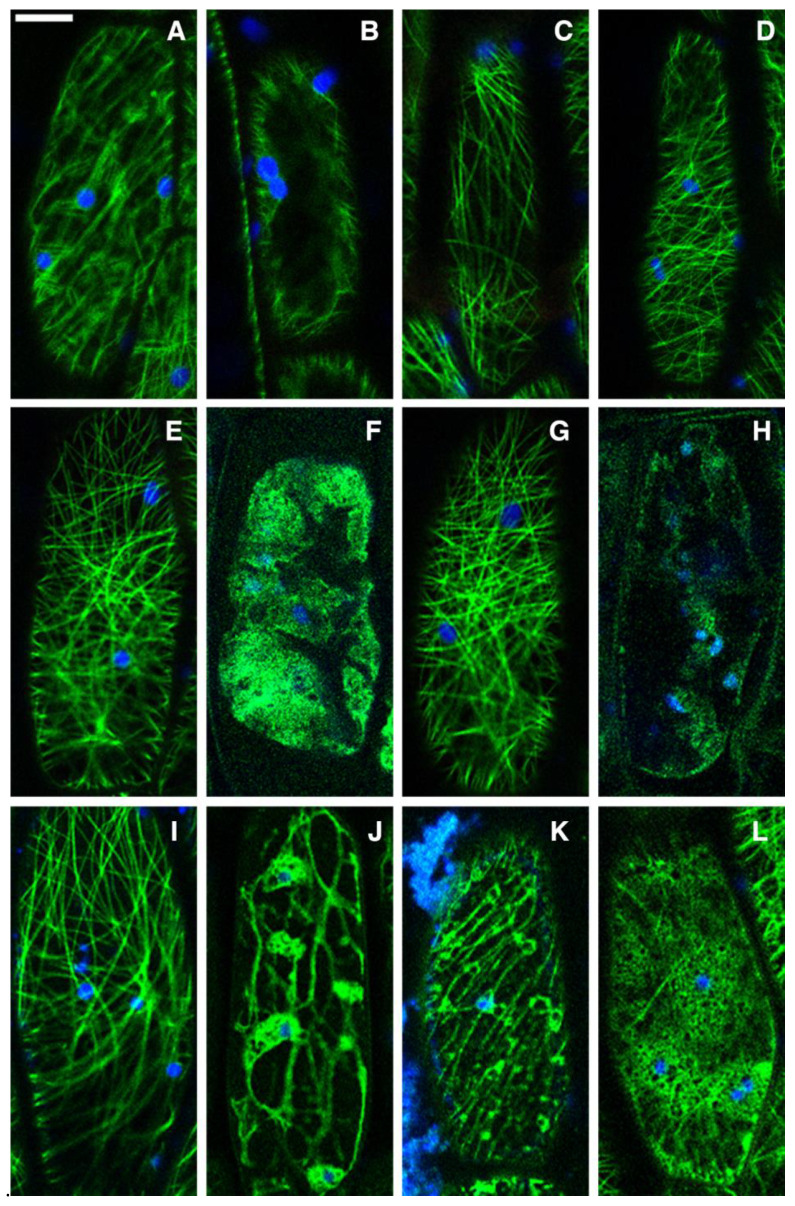
Figure 4.
Confocal images of hypocotyl cells of A. thaliana stably expressing GFP-TUA6. Normal distribution of labelled microtubules in controls (A,B) with DMSO (C) and after high-dose AE treatment for 18 h (D). No effects of HE at low dose after 1 h (E) and collapse of cell after 18 h (F). Similarly, no effect observed with HE at high dose after 1 h (G), but the cell collapse after 18 h (H). No effects of ME at low dose after 1 h (I) and evident effects after 18 h (J). Evident effects of ME at high dose already in 1 h (K), increasing after 18 h (L). In blue the epifluorescence of chlorophyll. Scale bar: 10 µm.

