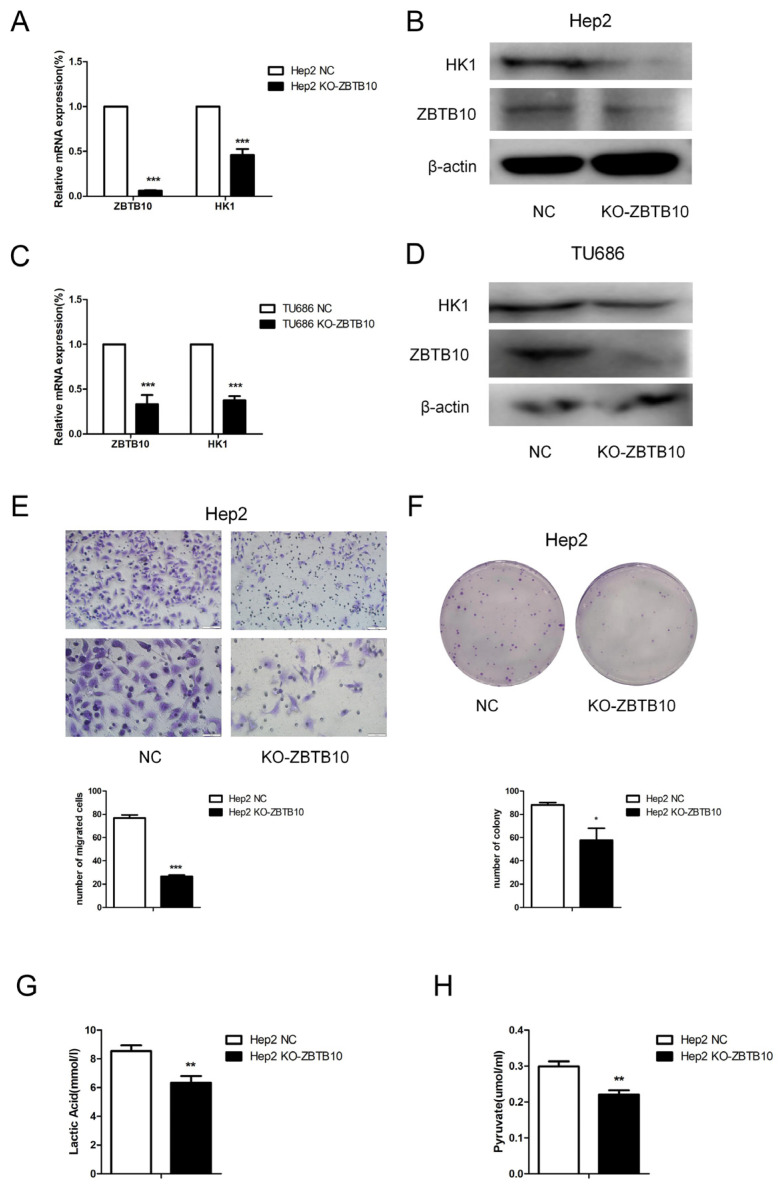
Figure 8.
ZBTB10 knockout attenuated glycolysis induced by intermittent hypoxia-exposed M2-type macrophage supernatant. (A–D) The results of qPCR and Western blotting confirmed ZBTB10 knockout in Hep2 and TU686 cells. (E) Transwell migration assay and statistical graph (100× and 200×). (F) Colony formation assay and statistical graph. (G,H) Lactate and pyruvate assays. The data are presented as the mean ± SD values. * p < 0.05; ** p < 0.01; *** p < 0.001.

