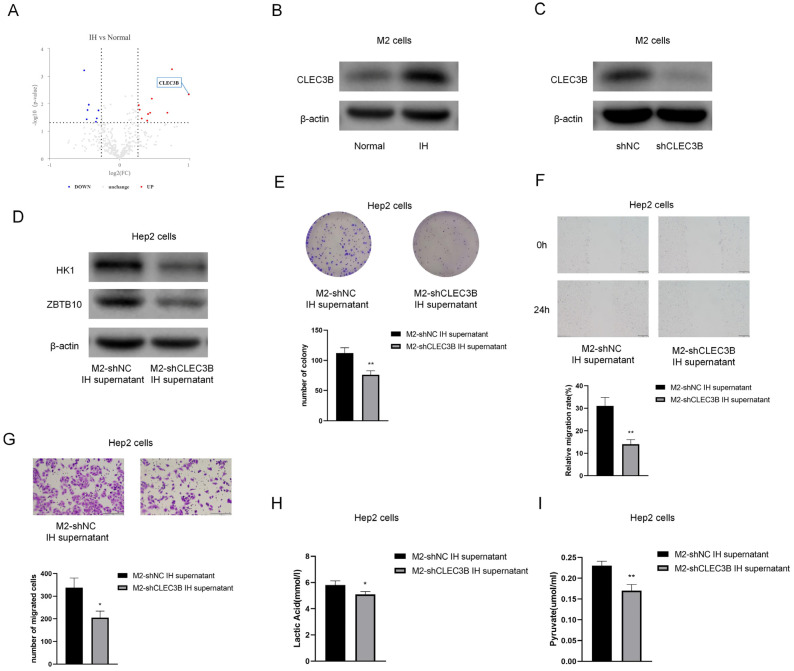
Figure 10.
CLEC3B level of M2 supernatant is significantly higher in IH group and showed protumor effect on Hep2 cells. (A) Volcano plot displaying proteomics data. (B) The results of Western blotting confirmed CLEC3B in M2 cells. (C) Representative immunoblot analysis of CLEC3B protein expression in shNC or shCLEC3B M2 cells. (D) Representative immunoblot analysis of HK1 and ZBTB10 of Hep2 cells under M2-shNC supernatant or M2-shCLEC3B supernatant treatment. (E) Colony formation assay. (F) Wound-healing assay (100×). (G) Transwell migration assay (100×). (H,I) Lactate and pyruvate assays. The data are presented as the mean ± SD values. * p < 0.05; ** p < 0.01.

