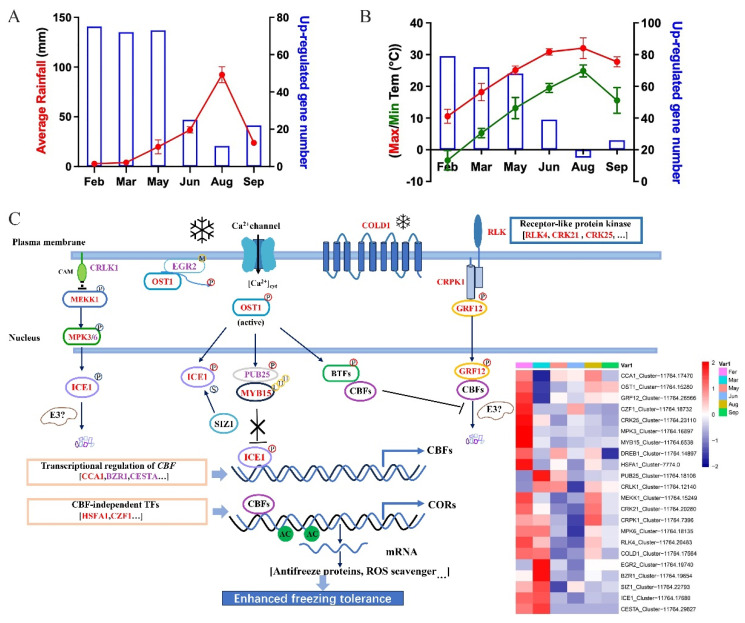
Figure 3.
(A) Gene number of “response to water deprivation” and average rainfalls. In each plot, blue bars (right Y-axis) indicate gene number of “response to water deprivation” found in elm branches sampling in different months, while red line (left Y-axis) indicates seasonal average rainfalls in sampling location. (B) Gene number of “response to cold” and max/min temperature. In each plot, blue bars (right Y-axis) indicate gene number of “response to cold” found in elm branches sampling in different months, while red/green line (left Y-axis) indicates max/min temperature in sampling location. (C) Predicted regulatory mechanisms of cold response in elm. Cold signaling involves transcriptional, post-transcriptional, and post-translational events. The genes up-regulated in May/June were marked with red/purple color, and others were marked by black. The expression levels (FPKM) of selected differentially expressed genes in May and/or June are shown on the right. A red color indicates that the gene is highly expressed in the branch samples.

