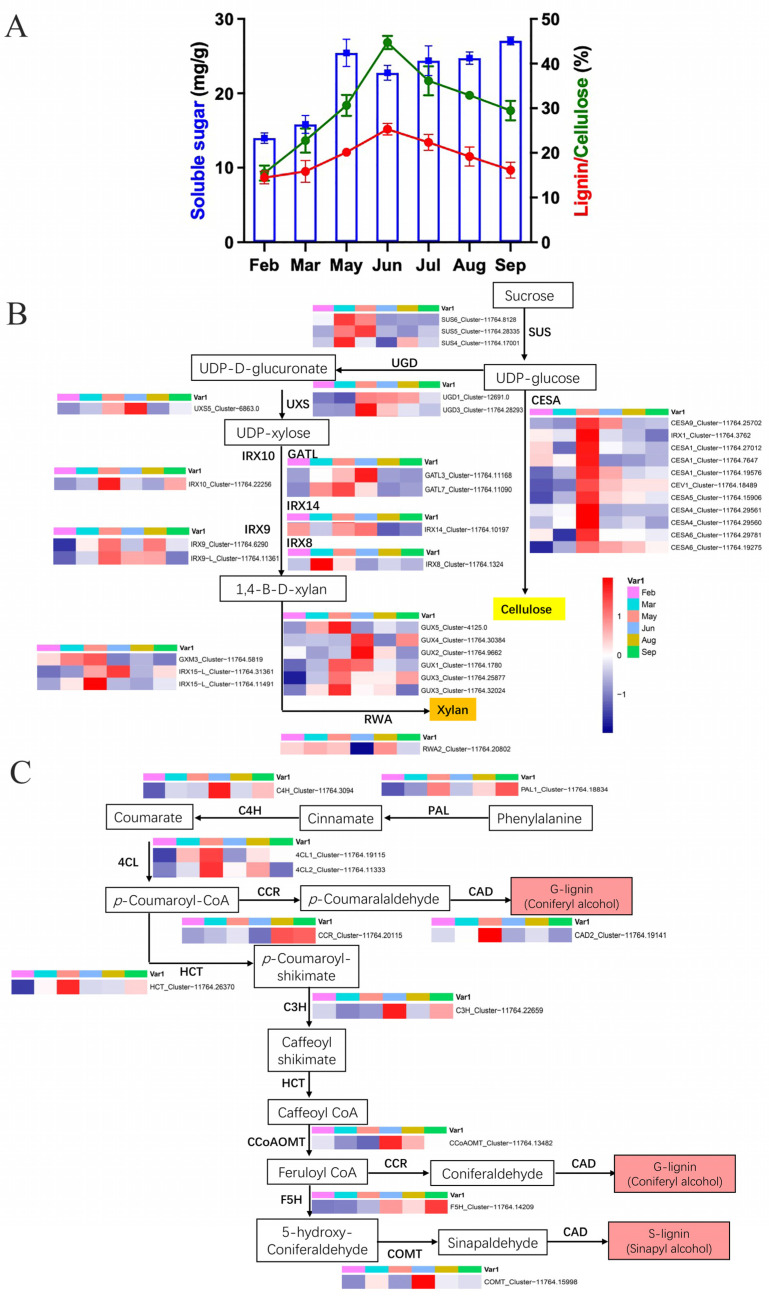
Figure 4.
(A) Soluble sugar, cellulose, and lignin contents. Blue bars (right Y-axis) indicate soluble sugar content, while red/green lines (left Y-axis) indicate cellulose/lignin contents. (B) Identification of major players within cellulose and xylan biosynthetic pathways for secondary wall. Metabolites in each step of the biosynthetic pathway are shown in the box, and all related genes are shown to the side. Color gradient according to the expression levels (FPKM) was visualized. (C) Identification of major players within monolignol biosynthetic pathways for secondary wall.

