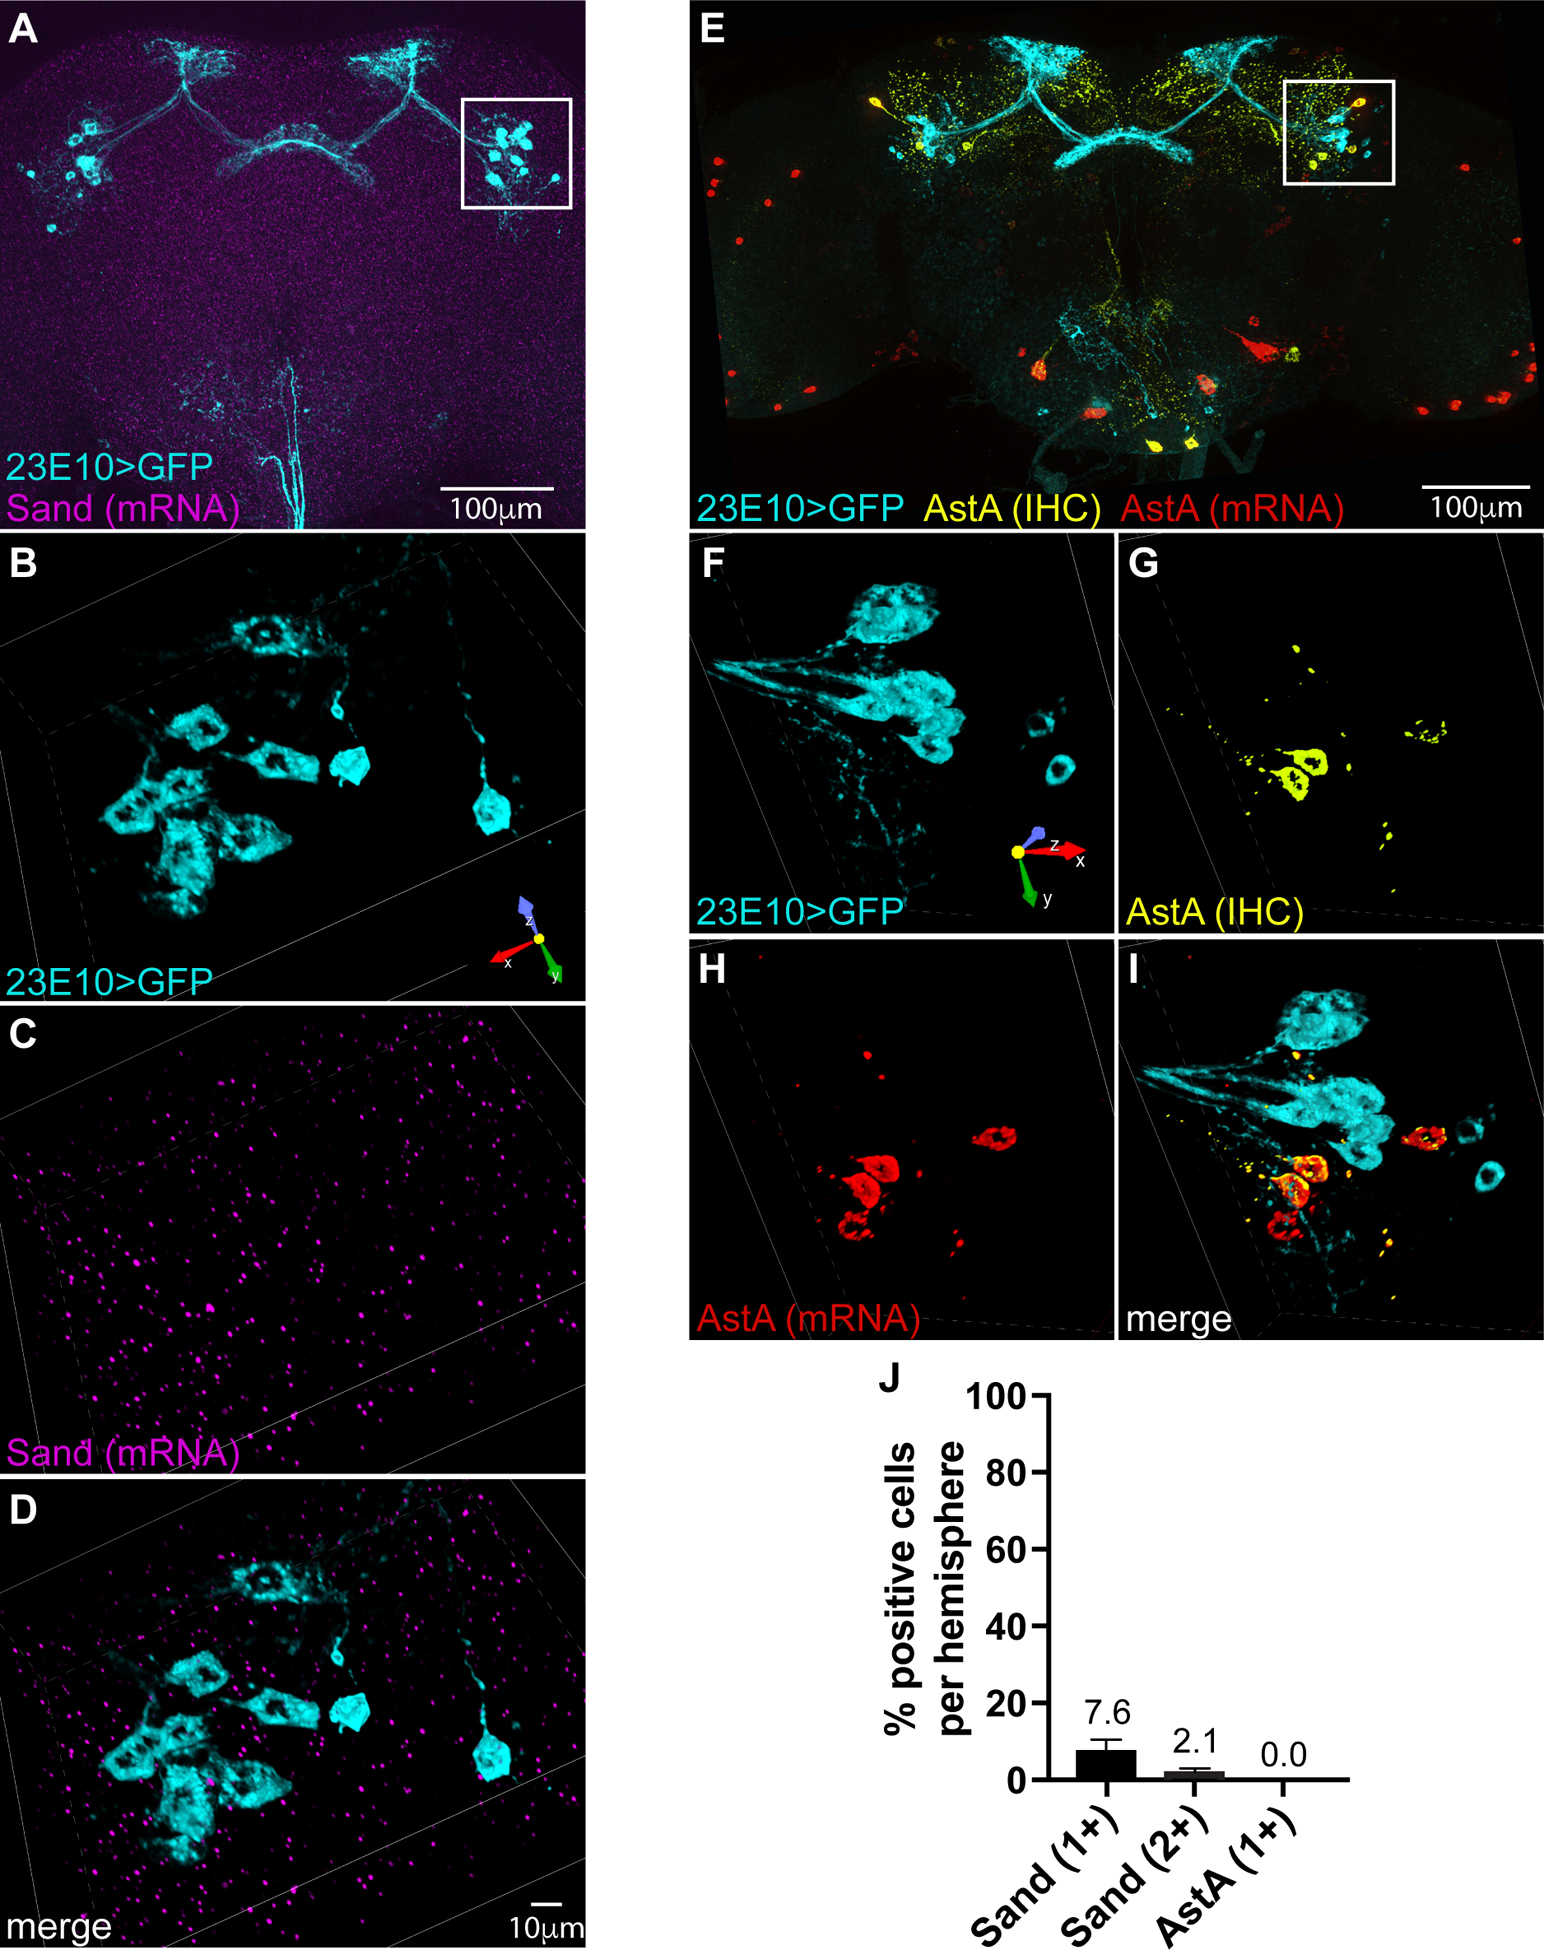
Figure 5. Sand and AstA transcripts exhibit little to no expression in 23E10 neurons.

(A) Whole-brain image with multiplexed labeling of 23E10-driven GFP by IHC and Sand transcript by RNAscope. (B-D) Rotated volumetric reconstruction (.25 um slices) of inset in A showing 23E10-labeled cell bodies by IHC (B), labeling of Sand mRNA by RNAscope (C), and a merge of both labels (D). (E) Volume projection of whole mount brain with multiplexed labeling of 23E10-driven GFP by IHC, AstA protein by IHC and AstA transcript by RNAscope. (F-I) Rotated volumetric reconstruction (.25 um slices) of inset in E showing 23E10-labeled cell bodies by IHC (F), labeling of AstA protein by IHC (G), labeling of AstA mRNA by RNAscope (H), and a merge of all three labels (I). (J) Average percentage of 23E10 cell bodies per hemisphere that show one or two puncta of each mRNA. N=36 (AstA) and N=71 (Sand) total GFP-positive cells analyzed per group. See also Figure S4.
