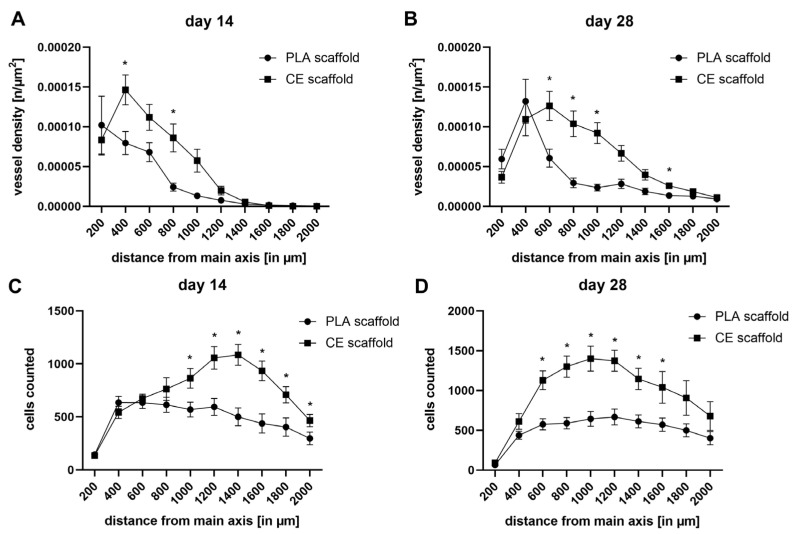
Figure 4.
Vessel density (A,B) and cell counts (C,D) in spatial relationships to the main vessel axis. Peak vessel density shifted towards more peripheral parts of the construct over time in both scaffolds (A,B). However, both matrices showed distinct properties in terms of vessel formation (* p < 0.05, comparing scaffold types). Peak cell counts in CE constructs on day 28 where higher in central parts of the construct compared to PLA constructs (* p < 0.05, comparing scaffold types).

