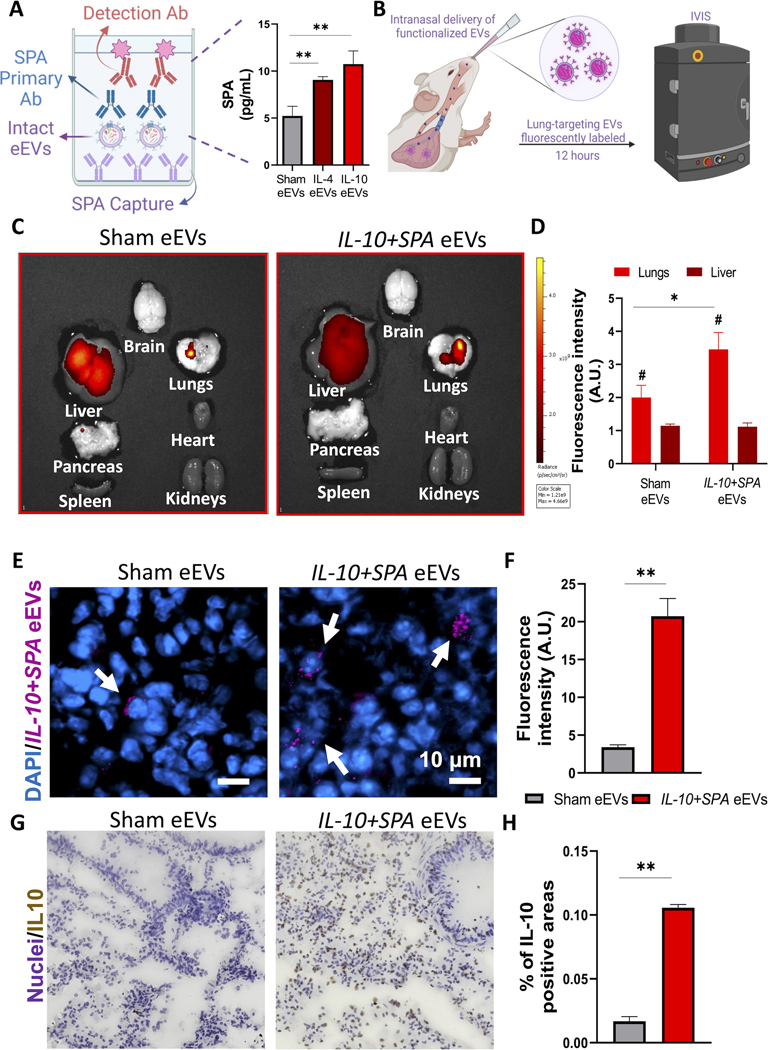
Fig. 4. SPA functionalized anti-inflammatory eEVs with improved lung retention and accumulation.
A) Schematic representation of the detection of SPA protein on the surface of the eEVs and data showing the successful transfer of the episomally expressed ligand SPA to the surface of the eEV membrane confirmed via ELISA compared to sham EVs. B) Schematic diagram illustrating the intranasal delivery of fluorescently labeled lung-targeting eEVs and analysis using an in vivo imaging system (IVIS) 12 hours after delivery. C) IVIS images of the major organs, showing the accumulation of the eEVs in the lungs, with a higher retention when treated with SPA-functionalized IL-10+SPA eEVs compared to non-functionalized (sham) EVs and D) comparative analysis of the fluorescence radiant efficiency units to quantify eEV accumulation. E) Immunofluorescence images of lung tissue samples after IVIS of animals treated with fluorescently labeled (Far-Red) sham and IL-0+SPA eEVs co-localized with the nuclei of the cells in blue (DAPI), 12 hours after intranasal delivery (arrows pointing at positive cells). F) Respective fluorescence intensity quantification of 4 lung tissue sections per animal. Scale bar 10μm. G) DAB staining images showing the positive expression of IL-10 in the lungs of animals treated with IL-10+SPA eEVs compared to sham eEVs, this signal was co-localized with the nuclei of the cells. H) Quantification of IL-10 expression (% of positive areas) in the lung tissue showing an overexpression of IL-10 in the IL-10+SPA eEV-treated group compared to the sham eEV-treated group. (n=4) All error bars are shown as SEM. *p<0.05 and **p<0.001, #significant difference with respect to the control with a p-value<0.05, One-way ANOVA or Two tail t-test when appropriate.

