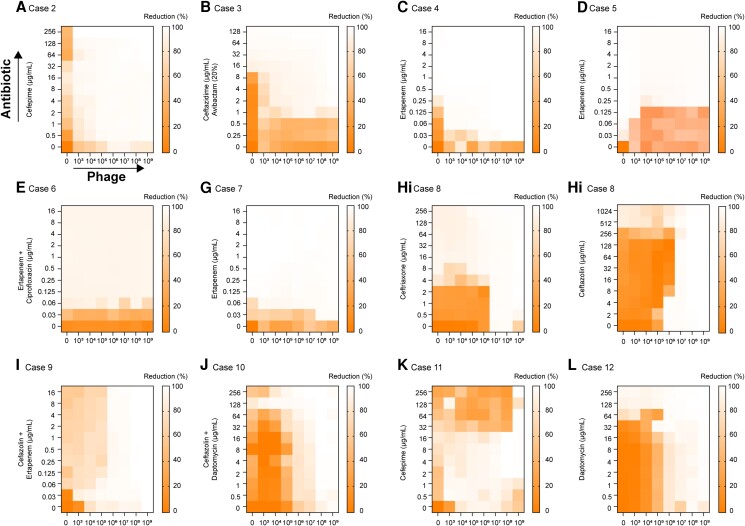
Figure 3.
The phage–antibiotic combination for each case (A–L) was determined using OD (600-nM) measurements that were taken every 15 minutes. Synograms (t = 24 h) represent the mean reduction percentage of each treatment from 3 biological replicates: Reduction (%) = [(ODgrowth control − ODtreatment)/ODgrowth control] × 100. The “y” axis is the antibiotic concentration and the “x” axis is the phage concentration (PFU/mL). Abbreviations: OD, optical density; PFU, plaque-forming units.

