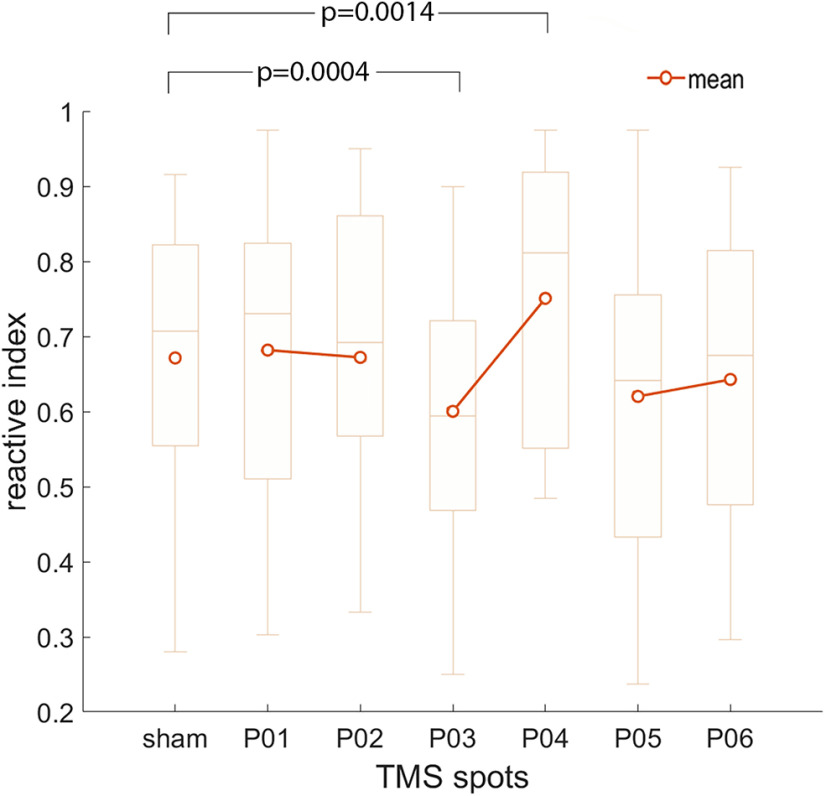
Figure 6.
Results of experiment 2. Box-whisker plot indicating mean, median (horizontal segment in the box) first and third quartiles (box extremities) and maximum and minimum values. p-values indicate the significant comparisons between sham and the active TMS spots. Note that only P03 and P04 differed significantly from sham stimulation.

