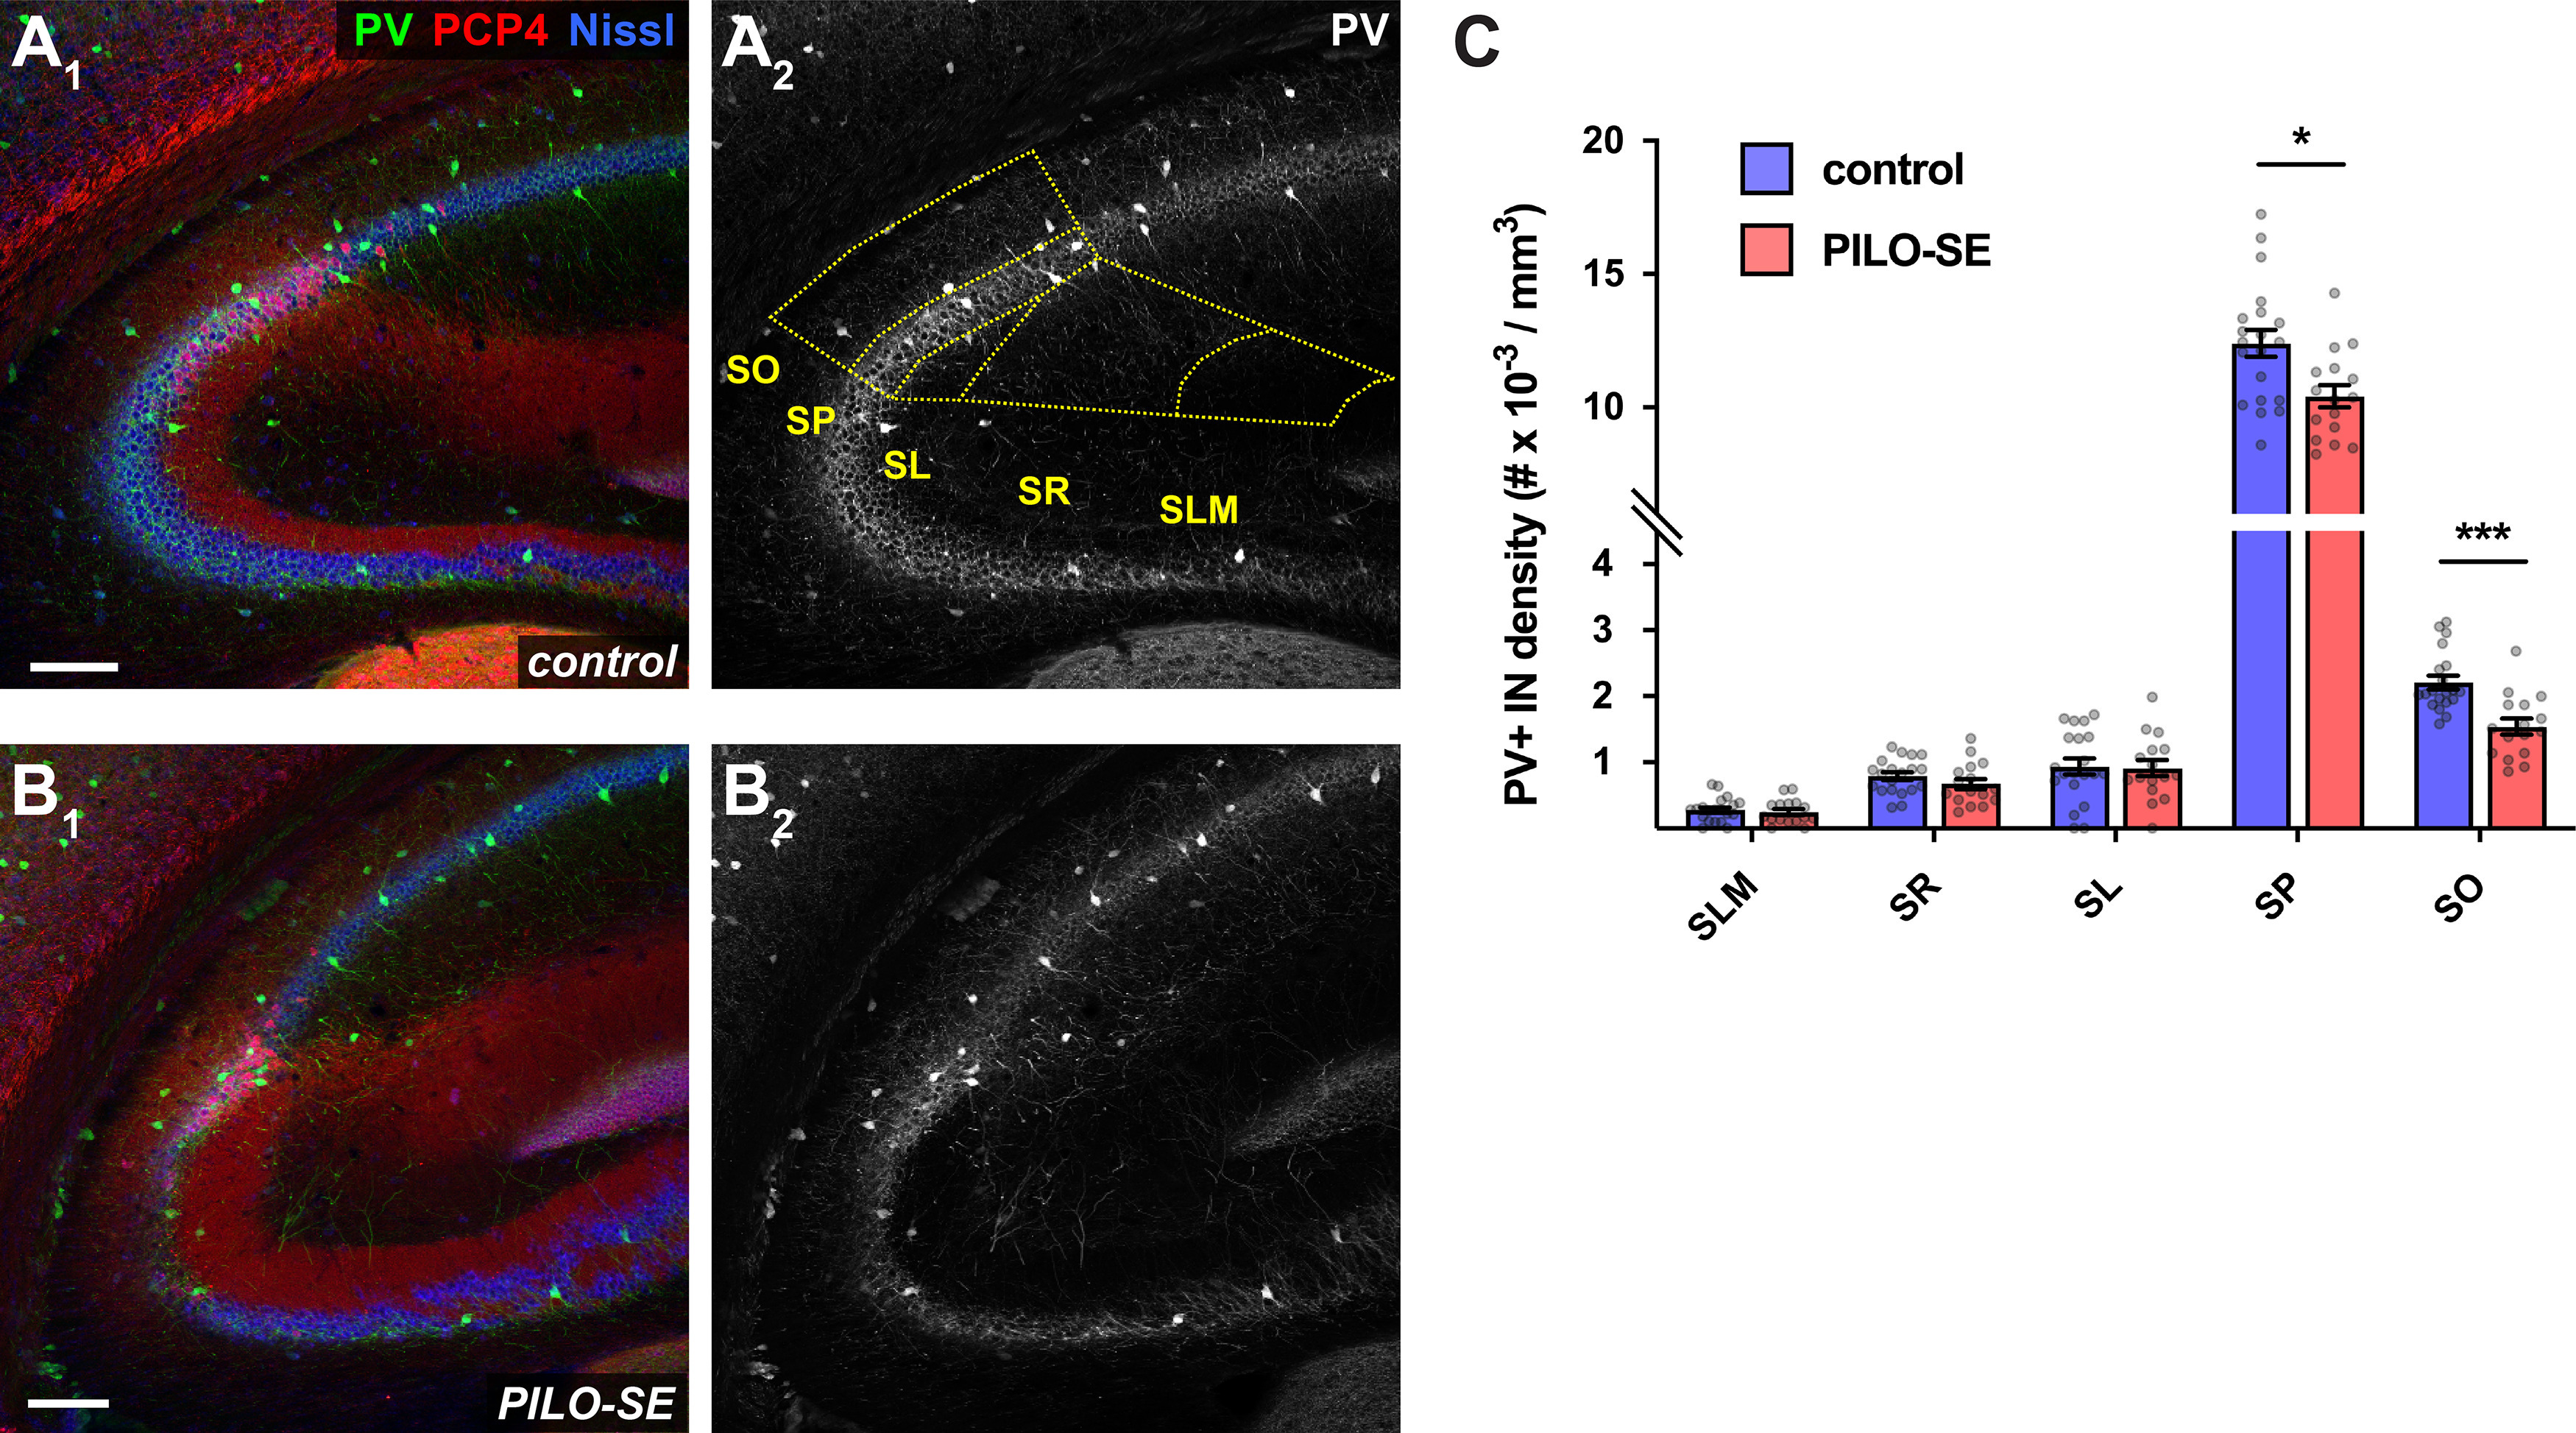
Figure 4.

The density of PV+ interneurons was reduced in the CA2 subfield following PILO-SE. A1–B2, Representative hippocampal sections from control (above) and PILO-SE (below) mice, stained for PV (green and white) to visualize PV+ interneurons, Nissl to label neuronal somata (blue), and PCP4 (red) to delineate the CA2 subfield. The bounds of the CA2 region were drawn across all layers of each hippocampal section (A2, yellow dashed lines) and the density of PV+ interneurons was measured for each layer (see Materials and Methods). Scale bars, 150 µm. C, The density of PV+ INs in CA2 was reduced in the SO and SP layers in sections from PILO-SE mice.
