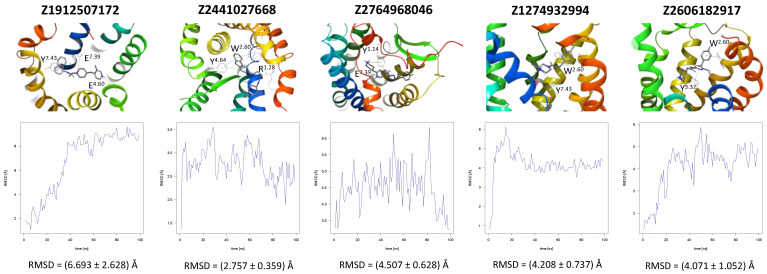
Figure 3.
Results of the MD simulations for CCR3 for five proposed compounds. (Top) The interactions between the receptor and the ligand obtained after 100 ns of the simulation. The receptor was shown in the red-to-blue color scheme; yellow dashed lines—hydrogen bonds; blue dashed lines—pi-pi stacking; green dashed lines—pi-cation; purple dashed lines—salt bridges. The residues have been labeled using Ballesteros–Weinstein numbering system [90]. (Bottom) The RMSD plots obtained for each of the ligands over the 100 ns simulation, as well as the average RMSD with its fluctuation range.

