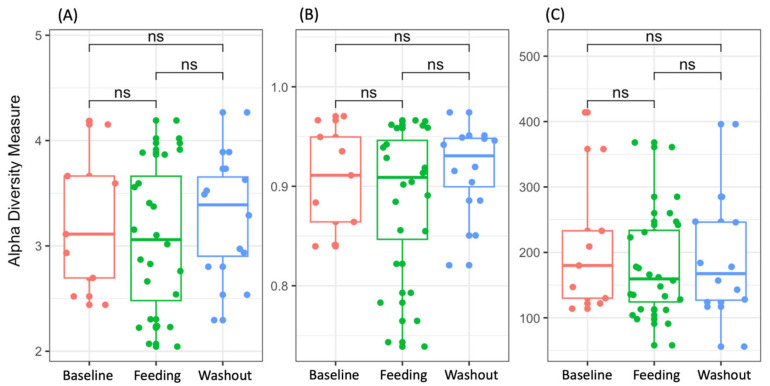
Figure 1.
Shannon (A), Simpson (B) and observed amplicon sequencing variant (ASV) (C) indices for each study period. Higher alpha diversity values represent higher diversity of the microbiota. The boxes represent the interquartile range (IQR) between the first and third quartiles (25th and 75th percentiles, respectively), and the horizontal line inside the box defines the respective median. In the figure, “ns” denotes “not significant” values.

