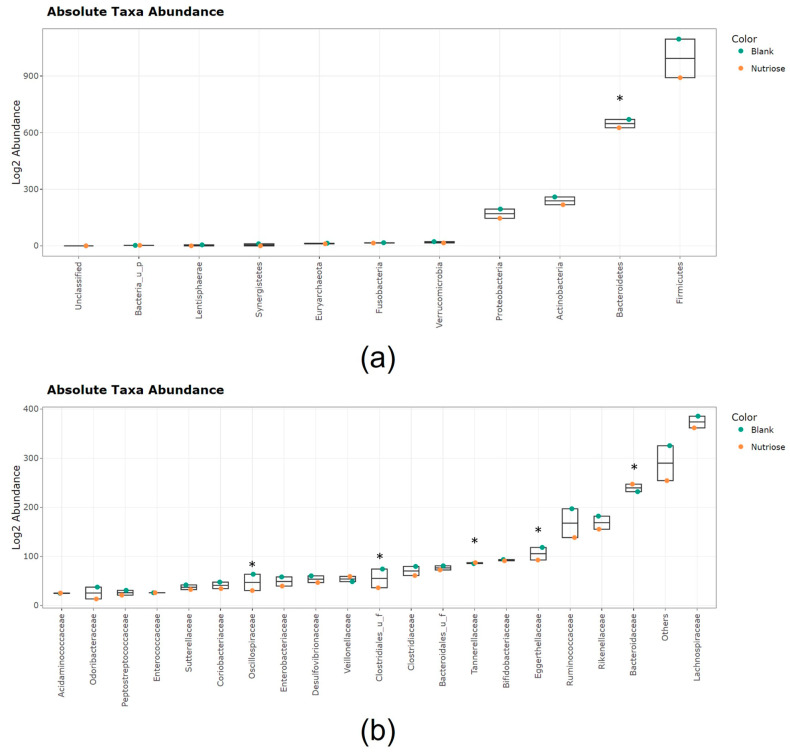
Figure 4.
Jitter plots showing average abundances (log2 abundances) at 48 h shown as (a) phylum and (b) family (20 most abundant families; the sum of abundances of the remaining families is categorized as ‘others’). Data for average values were derived using data from all 8 donors. Orange circles represent NUTRIOSE®-supplemented colonic microbiota and the turquoise circles represent blank colonic microbiota. UF, unidentified family. Asterisks indicate phyla/families that were differentially abundant in blank and NUTRIOSE® condition, for which statistical significance was reached based on treeclimbR.

