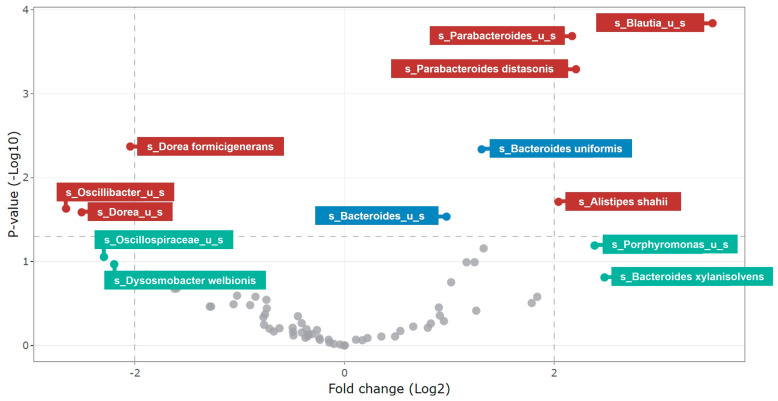
Figure 5.
Differential abundance analysis at 48 h using treeblimbR. A p-value of < 0.05 is considered statistically significant and a >4-fold change is considered biologically significant. Maroon circles represent biologically and statistically significant changes, turquoise circles represent biologically significant but not statistically significant changes; gray circles represent non-significant changes; and blue circles represent statistically significant but not biologically significant changes. US = unidentified species.

