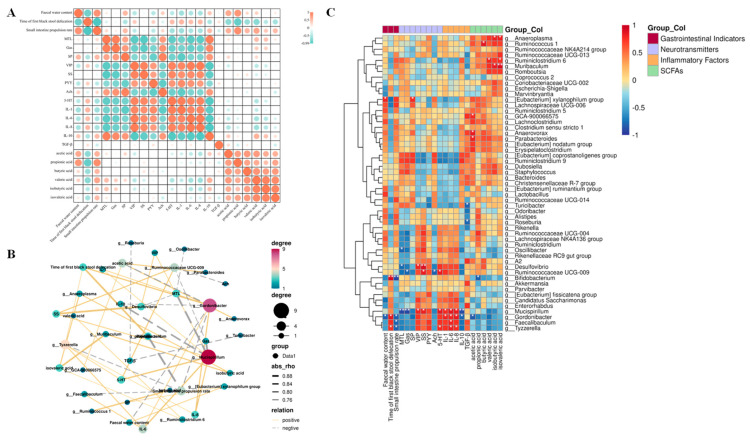
Figure 9.
A correlation analysis of intestinal microbiota and physicochemical indices in mice. (A) A correlation analysis of gastrointestinal indicators and constipation apparent indices. (B) A network diagram of the Pearson correlation analysis. (C) A Pearson correlation analysis of the correlation between intestinal bacterial abundance and constipation−related biomarkers. A solid line represents a positive correlation, and a dotted line represents a negative correlation. The thickness of the arrow represents the size of the correlation coefficient. (* p < 0.05, ** p < 0.01).

