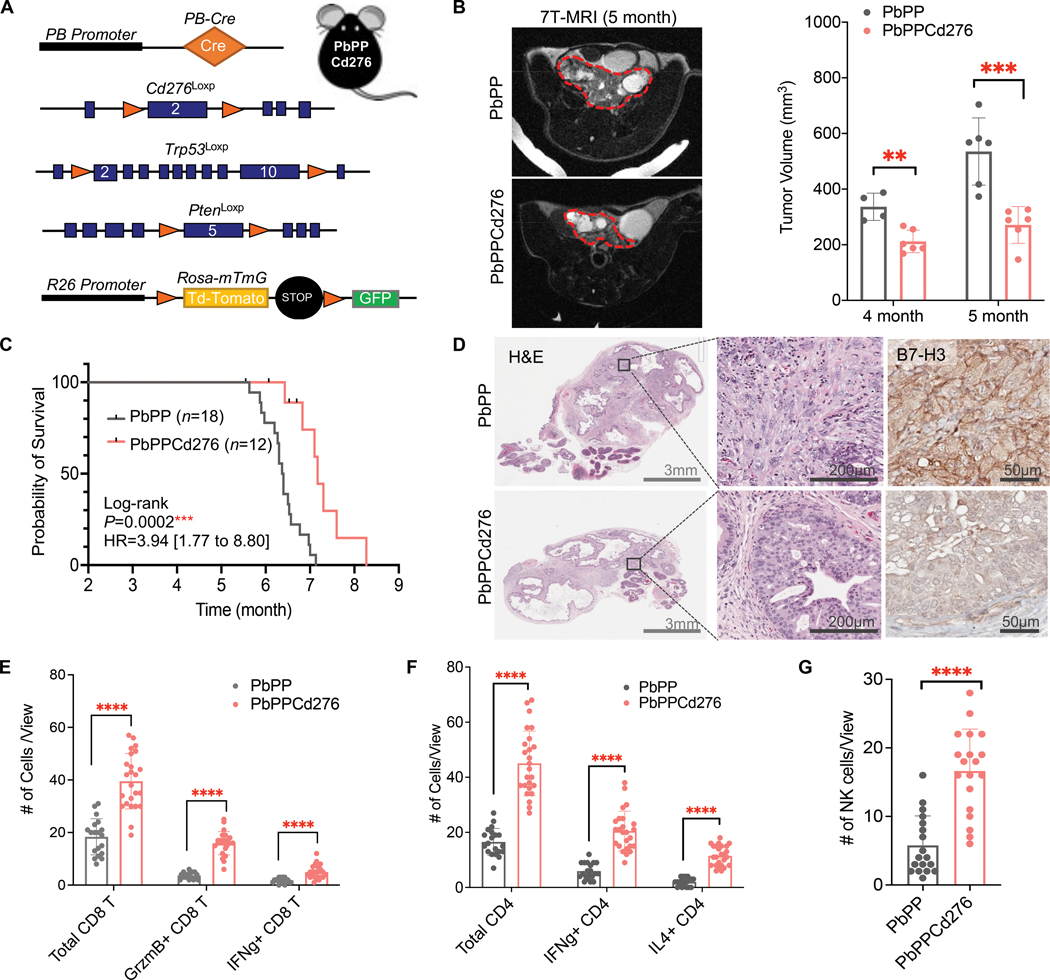
Figure 4. Prostate-specific Cd276 deletion GEMM model demonstrates B7-H3’s impact on prostate cancer progression.
(A) GEMM model design: conditional knockout (KO) alleles of Cd276Loxp, PtenLoxp, and Trp53Loxp were crossed with prostate-specific PB-Cre and Rosa-mTmG to establish PB-Cre; PtenL/L; Trp53L/L; Cd276L/L (PbPPCd276) GEMM model. (B) Representative MRI images and tumor volume quantification of prostate tumors from PbPP and PbPPCd276 mice at four and five months of age (n ≥ 4 per group per age). Prostate tumor regions are circled with red dashed lines. (C) Kaplan–Meier survival curve of PbPP and PbPPCd276 mice. Statistical analysis by Log-rank (Mantel-Cox) test. (D) Histopathology analysis of prostate tumors from PbPP and PbPPCd276 mice at five months of age. H&E images at 1x (left) and 20x (middle) magnifications are presented. Depletion of B7-H3 was verified by IHC staining (right). Scale bars are indicated in each image. (E, F) Multiplex IHC staining and quantification of indicated CD8 T (E) and CD4 T (F) cells in prostate tumors from PbPP and PbPPCd276 mice ( n >10 individual views from 3–5 mice per group). Data represent the mean ± SD. (G) Immunofluorescence (IF) and quantification of NK (NK1.1+) cells in PbPP and PbPPCd276 tumors. Data represent the mean ± SD of >10 individual views. Student’s t-tests were performed using GraphPad Prism version 9.2.0. ∗P < 0.05, ∗∗ P < 0.01, ∗∗∗∗ P < 0.0001. ns, not significant.

