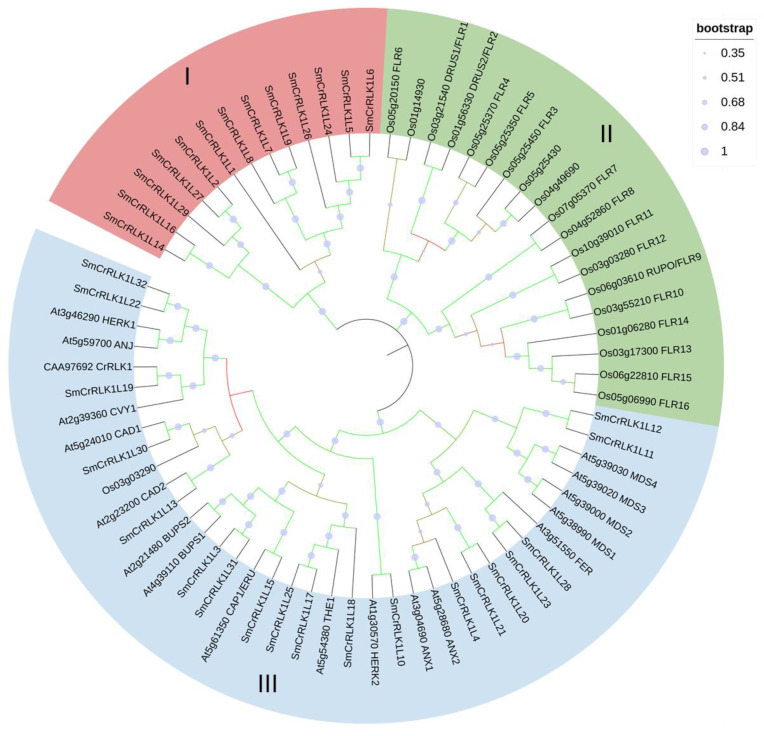
Figure 1.
Phylogenetic analysis of CrRLK1Ls in eggplant, Catharanthus roseus, Arabidopsis, and rice. Different groups are represented by different colors. The bootstrap metadata display was indicated by symbol circles and color gradient (red to green: 0.352 to 1). I, II and III refer to the subfamilies divided by phylogenetic analysis.

