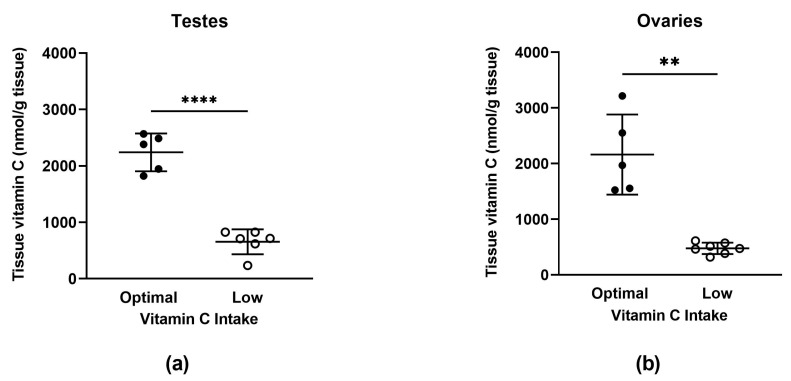
Figure 2.
Vitamin C concentrations in testes (a) and ovaries (b). Optimal (full circles, n = 5 testes, n = 5 ovaries) and low (open circles, n = 6 testes, n = 7 ovaries). Data are presented as individual points with group means ± SD. An asterisk indicates significance between bars linked with black lines; ** = p < 0.01 and **** = p < 0.0001. Data were analysed using unpaired t-tests (with Welch’s correction for heterogeneity of variance applied to ovaries).

