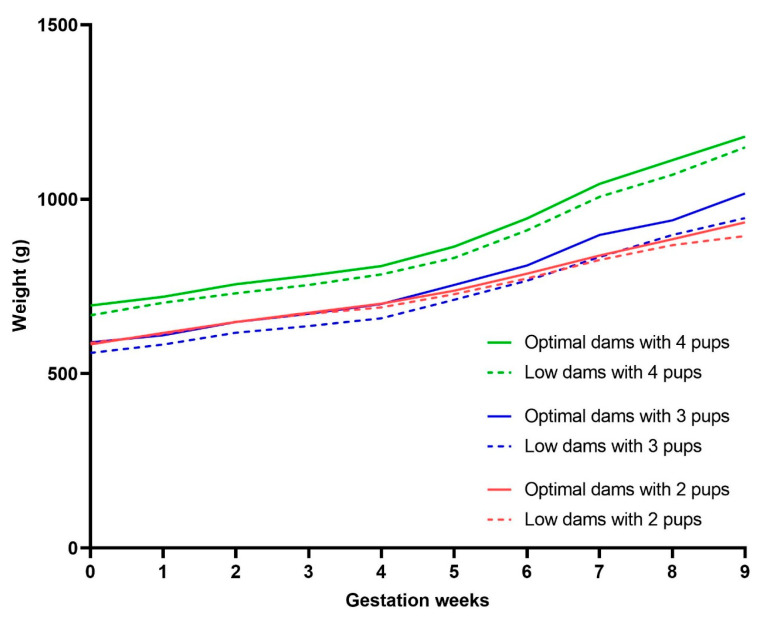
Figure 3.
Pregnancy weight gain in litters of equal size. The graph represents the average weight gain during pregnancy (day of mating to week of delivery). Full lines = optimal dams and dashed lines = low dams. Dams with 4 pups (green lines, n = 10 optimal, n = 6 low), dams with 3 pups (blue lines, n = 11 optimal, n = 10 low), and dams with 2 pups (red lines, n = 6 optimal, n = 12 low). Data were analysed using repeated measures mixed-effects two-way ANOVA.

