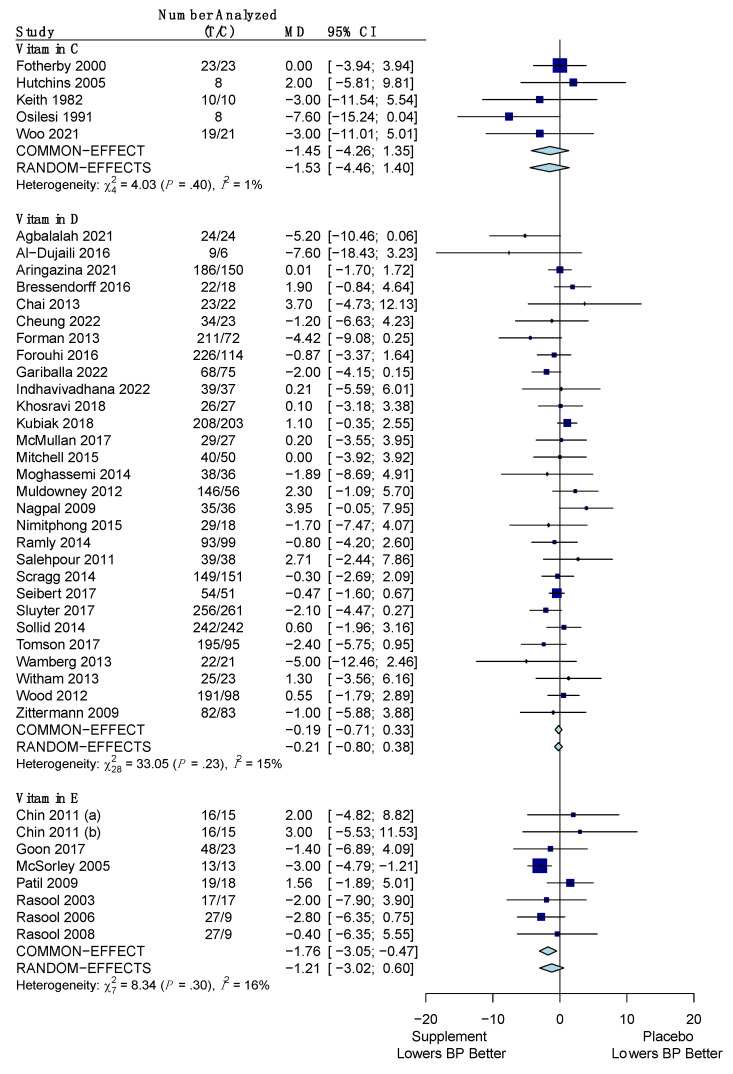
Figure 3.
Forest plot showing the mean difference of change in systolic blood pressure between vitamins (C, D, E) and placebo. T represents the sample size of the treatment (supplement/vitamin) group and C represents the sample size of the control (placebo) group. The pooled mean difference is given in mm Hg with its 95% CI. The weighted mean difference in mm Hg and its 95% CI is given for each study. A graphical representation with the weighted mean difference and its SE is also given for each study. References: Vitamin C ([51,56,61,85,112]); Vitamin D ([33,34,35,42,43,44,49,50,52,57,63,64,74,75,79,81,83,87,97,99,100,104,105,107,108,111,112,113,122,124]); Vitamin E ([86,88,89,90,115,117,120]).

