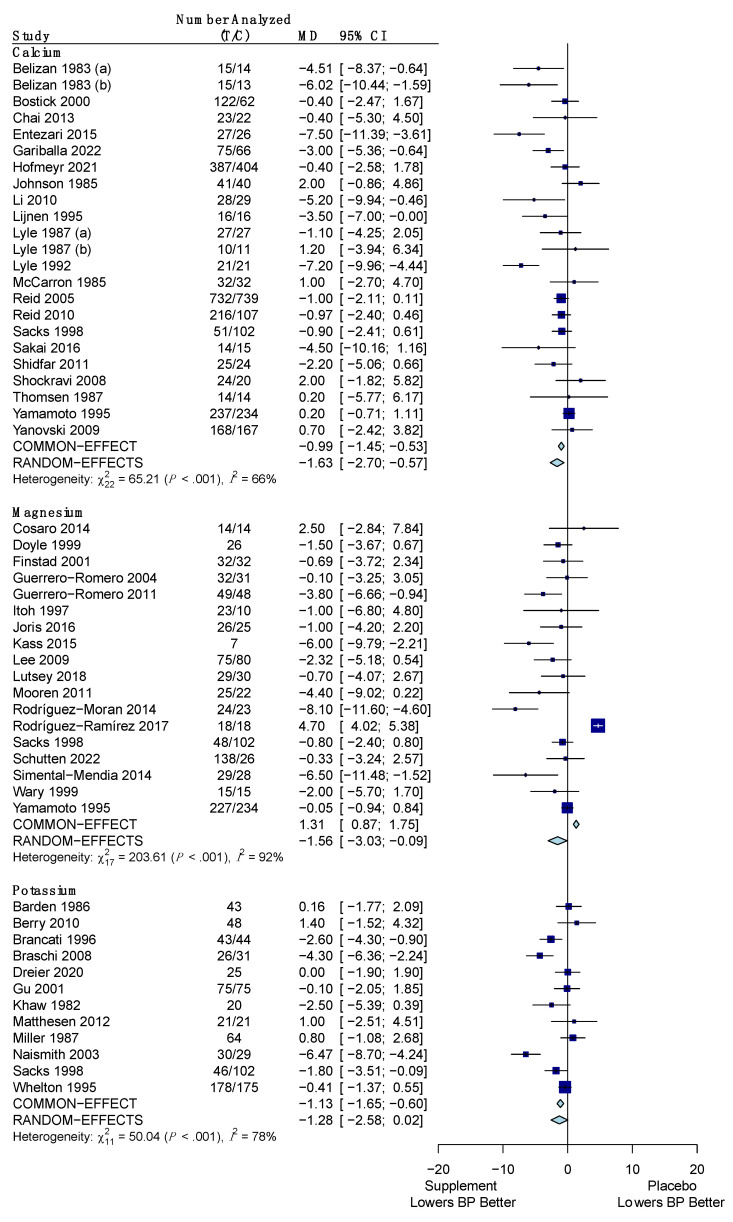
Figure 6.
Forest plot showing the mean difference of change in diastolic blood pressure between minerals (calcium, magnesium, potassium) and placebo. T represents the sample size of the treatment (supplement/mineral) group and C represents the sample size of the control (placebo) group. The pooled mean difference is given in mm Hg with its 95% CI. The weighted mean difference in mm Hg and its 95% CI is given for each study. A graphical representation with the weighted mean difference and its SE is also given for each study. References: Calcium ([37,39,43,52,55,66,67,70,71,73,91,92,95,96,101,102,106,114,116,119,123]); Magnesium ([45,46,48,54,58,59,60,65,69,76,93,94,95,98,103,109,114,118]); Potassium ([36,38,40,41,47,53,62,72,82,95,110,121]).

