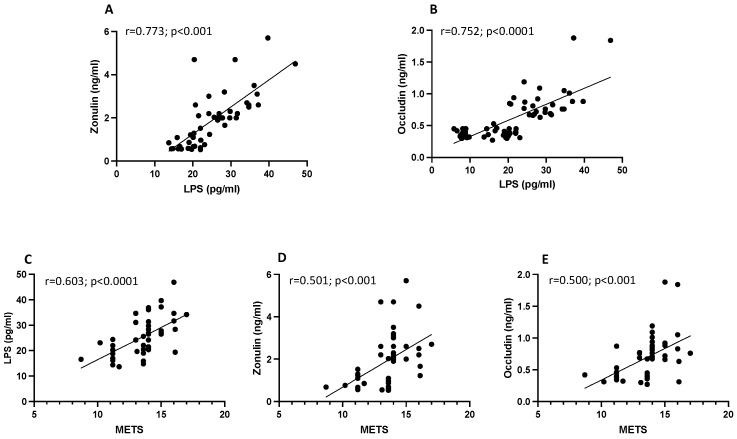
Figure 2.
Scatter plots showing significant (2-tailed) Spearman positive correlations of zonulin (A) and occludin (B) in vertical vs. horizontal directions of LPS concentrations and of LPS (C), zonulin (D), and occludin (E) in vertical vs. horizontal directions of METs in 23 amateurs and 24 elite football players. Each dot represents a single individual value.

