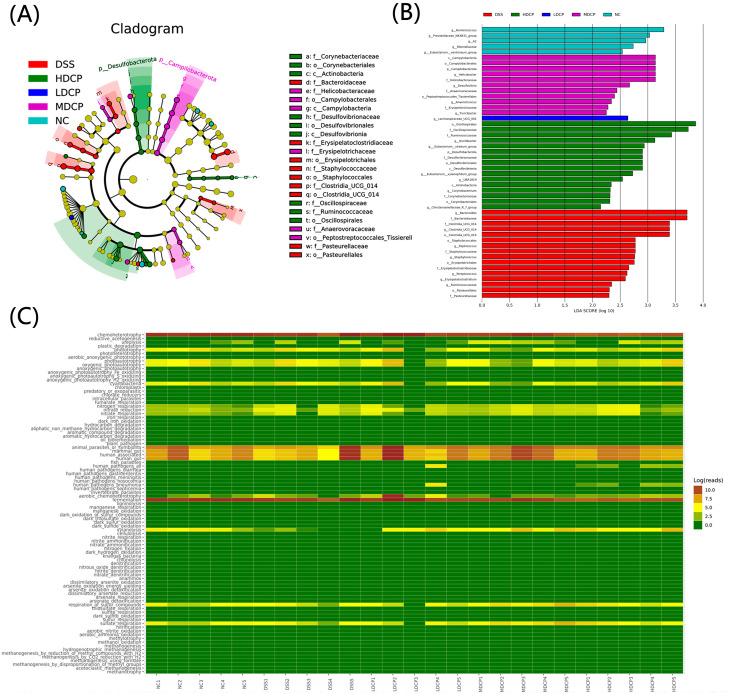
Figure 11.
CPH’s modulating effect on gut microbiota. (A) Cladogram demonstrating taxa richness among different groups. (B) LEfSe analysis bar represents the abundant taxonomic biomarker at different taxa levels. (C) Heatmap analysis representing metabolic function and other significant activities in groups.

