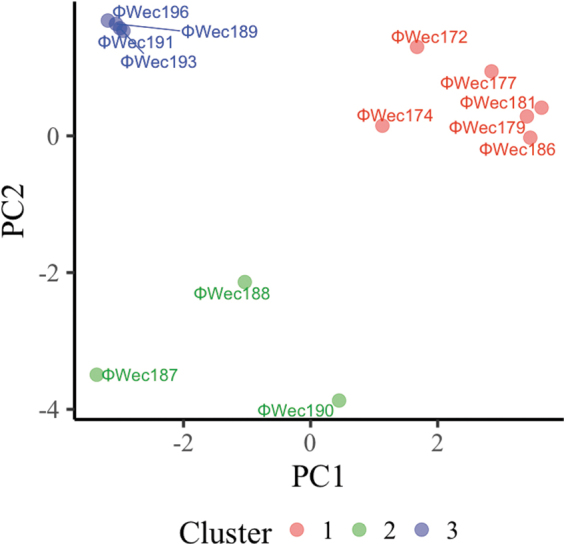
FIG. 3.

Clustering of normalized phage phenotypes. Each phage was plotted with the first principal component (PC1) on the horizontal axis and the second principal component (PC2) on the vertical axis. Cluster 1 is red, Cluster 2 is green, and Cluster 3 is blue. The Euclidean distance between the phages was calculated using the values of each principal component of each phage, and hierarchical clustering was performed using the minimum variance method (Ward's method) to produce three clusters.
