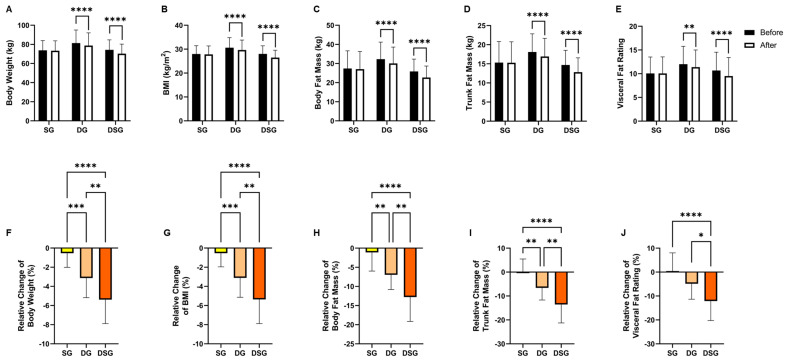
Figure 2.
Changes in anthropometric measures. (A) Body weight, (B) BMI, (C) body fat mass, (D) trunk fat mass, and (E) visceral fat rating before and after intervention. Relative change in (F) body weight, (G) BMI, (H) body fat mass, (I) trunk fat mass, and (J) visceral fat rating after intervention compared to baseline. Data are expressed as mean ± SD. Paired two-tailed t-test and one-way ANOVA followed by Tukey’s post hoc test were used for intragroup comparison and intergroup comparison, respectively. * p < 0.05, **: p < 0.01, ***: p < 0.001, ****: p < 0.0001.

