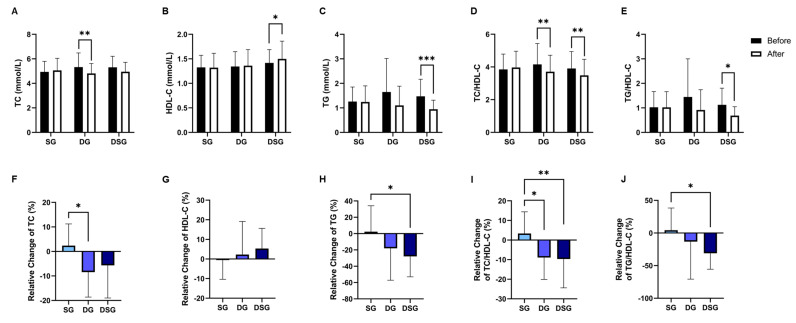
Figure 6.
Changes in lipid parameters. (A) TC, (B) HDL-C, (C) TG, (D) TC/HDL-C, and (E) TG/HDL-C before and after intervention. Relative change in (F) TC, (G) HDL-C, (H) TG, (I) TC/HDL-C, and (J) TG/HDL-C after intervention compared to baseline. Data are expressed as mean ± SD. Paired two-tailed t-test and one-way ANOVA followed by Tukey’s post hoc test were used for intragroup comparison and intergroup comparison, respectively. *: p < 0.05, **: p < 0.01, ***: p < 0.001. TC: total cholesterol; HDL-C: HDL-cholesterol; TG: triglycerides.

