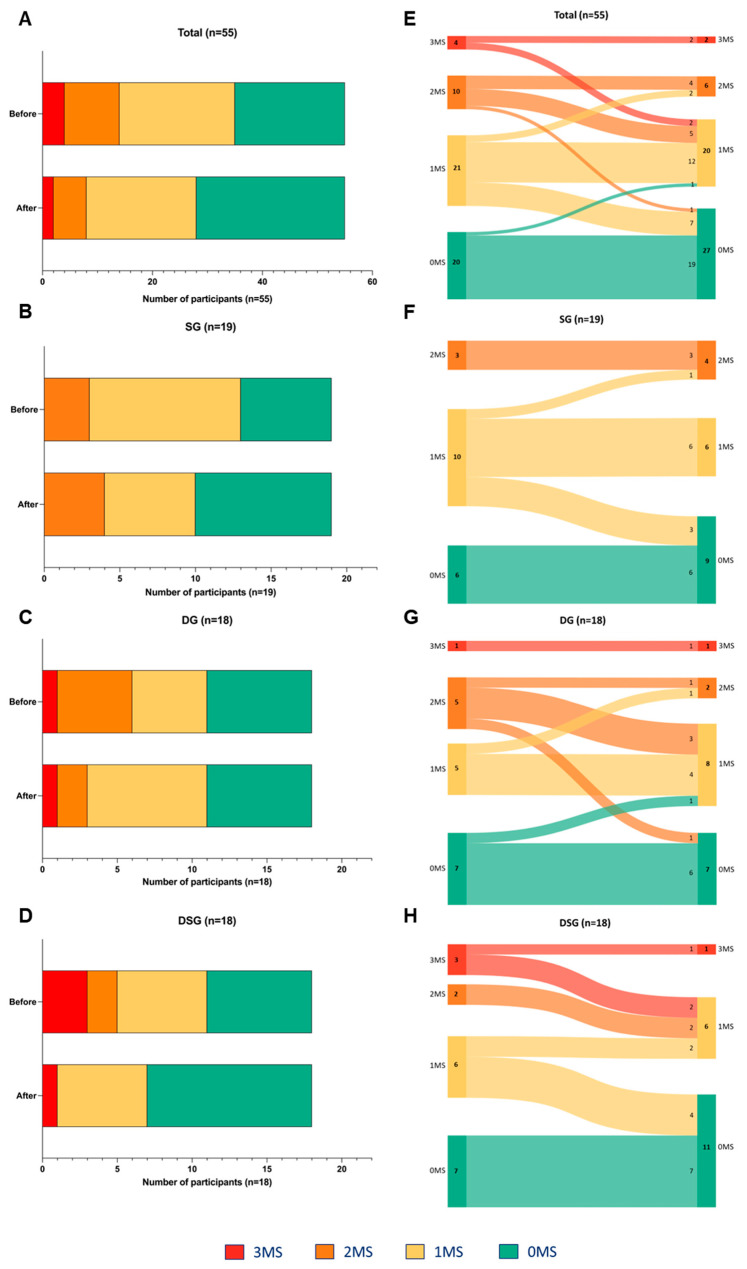
Figure 8.
Changes in the number of MetS traits among (A) all, (B) SG, (C) DG, and (D) DSG participants after intervention. Sankey diagrams showing the flow of MetS traits among (E) all, (F) SG, (G) DG, and (H) DSG participants after intervention. MS represents the MetS traits including abnormal fasting glucose, HDL-C, and TG levels.

