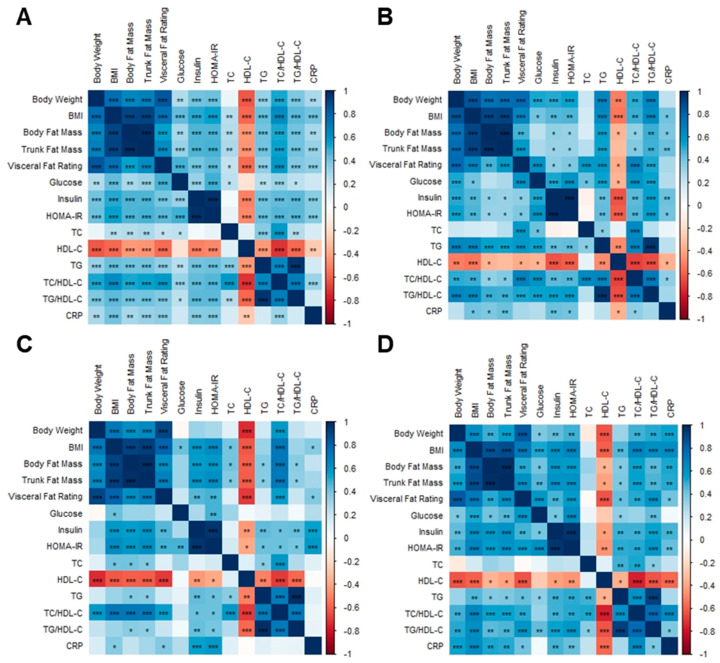
Figure 12.
Associations between body composition parameters and metabolic biomarkers. (A) Overweight and obese Hong Kong Chinese individuals, (B) SG, (C) DG, and (D) DSG. Blue squares indicate positive correlations, and red squares indicate negative correlations. *: p < 0.05, **: p < 0.01, ***: p < 0.001.

