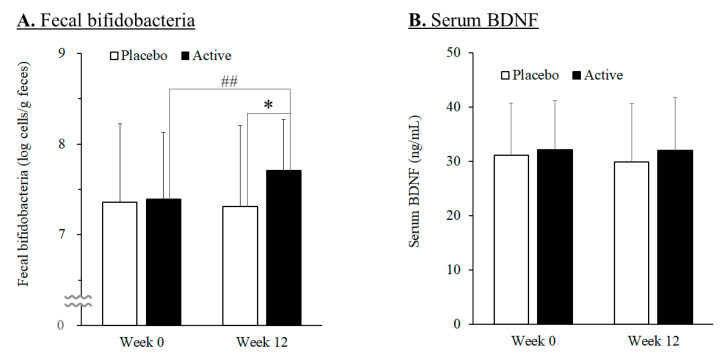
Figure 2.
Changes in fecal bifidobacteria (A) and in serum BDNF (B) in the placebo (n = 35) and active (n = 32) groups during the study period. Values are means, with error bars as standard deviation. Double number signs (##) indicate p-value < 0.01 as a result of intra-group difference (week 0 vs. week 12; paired t-test). Asterisk (*) indicates p-value < 0.05 as a result of inter-group difference (the placebo group vs. the active group; unpaired t-test).

