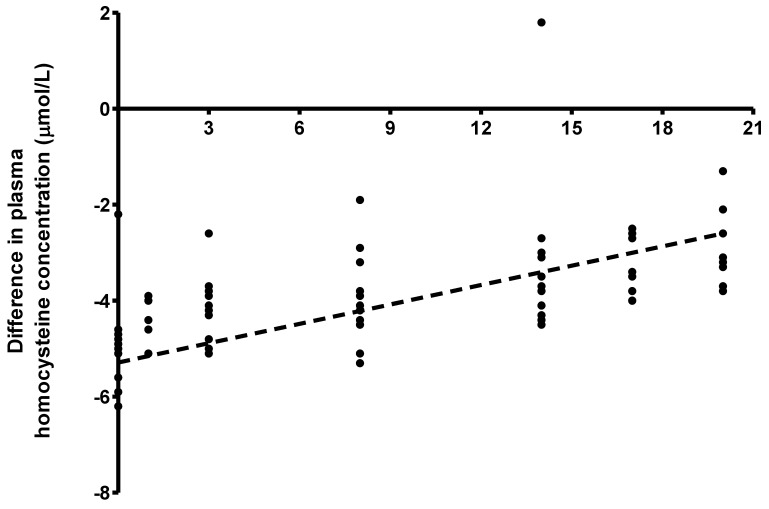
Figure 3.
Difference between plasma homocysteine concentrations at baseline (fasted state) and in response to graded intakes of methionine (fed state) (n = 8 females studied for a total of 38 observations and n = 7 males studies for a total of 38 observations). A linear increase in the difference in plasma homocysteine concentration in response to graded intakes of methionine (Rm2 = 0.34, Rc2 = 0.38; p < 0.001) was determined using a joint linear mixed effect model. The regression equation for the calculation of the difference from baseline in plasma homocysteine concentration in response to methionine intake is given by y = −4.61 + 0.0927x (p < 0.001).

