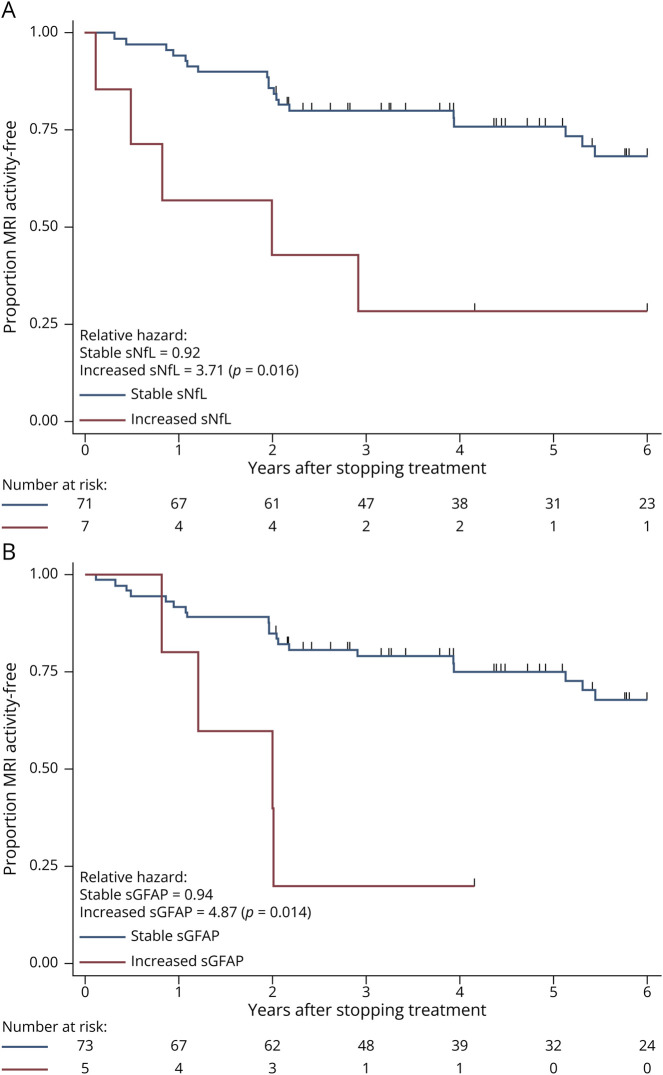
Figure 4. Time-to-MRI Activity.
Survival curves showing proportion of patients MRI activity-free at each time point. (A) Stratified by patients who had a >100% increase in sNfL values after discontinuation vs those with <100% increase. (B) Stratified by patients who had a >50% increase in sGFAP values after discontinuation vs those with <50% increase. Number at risk shown and patients censored at each stage shown as ticks. Relative hazards for each group with χ2 p values shown. EDSS = Expanded Disability Status Scale; sGFAP = serum glial fibrillary acidic protein; sNfL = serum neurofilament light chain.

