
Table 1.
Patient Characteristics
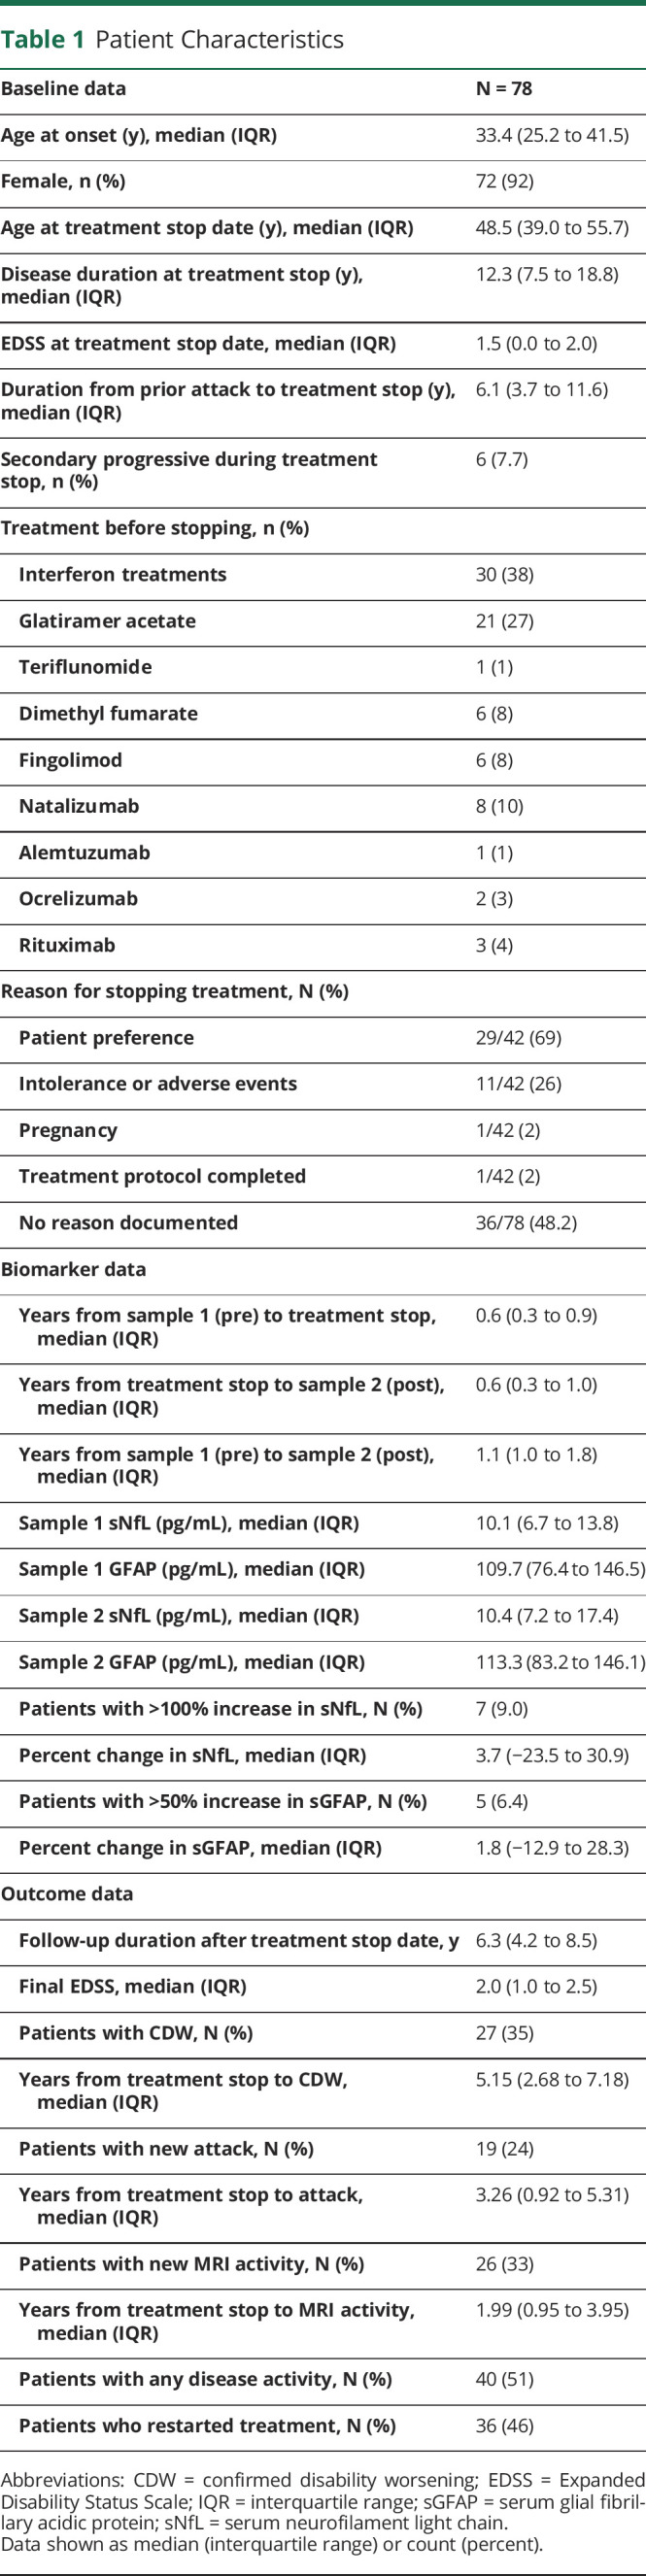
| Baseline data | N = 78 |
| Age at onset (y), median (IQR) | 33.4 (25.2 to 41.5) |
| Female, n (%) | 72 (92) |
| Age at treatment stop date (y), median (IQR) | 48.5 (39.0 to 55.7) |
| Disease duration at treatment stop (y), median (IQR) | 12.3 (7.5 to 18.8) |
| EDSS at treatment stop date, median (IQR) | 1.5 (0.0 to 2.0) |
| Duration from prior attack to treatment stop (y), median (IQR) | 6.1 (3.7 to 11.6) |
| Secondary progressive during treatment stop, n (%) | 6 (7.7) |
| Treatment before stopping, n (%) | |
| Interferon treatments | 30 (38) |
| Glatiramer acetate | 21 (27) |
| Teriflunomide | 1 (1) |
| Dimethyl fumarate | 6 (8) |
| Fingolimod | 6 (8) |
| Natalizumab | 8 (10) |
| Alemtuzumab | 1 (1) |
| Ocrelizumab | 2 (3) |
| Rituximab | 3 (4) |
| Reason for stopping treatment, N (%) | |
| Patient preference | 29/42 (69) |
| Intolerance or adverse events | 11/42 (26) |
| Pregnancy | 1/42 (2) |
| Treatment protocol completed | 1/42 (2) |
| No reason documented | 36/78 (48.2) |
| Biomarker data | |
| Years from sample 1 (pre) to treatment stop, median (IQR) | 0.6 (0.3 to 0.9) |
| Years from treatment stop to sample 2 (post), median (IQR) | 0.6 (0.3 to 1.0) |
| Years from sample 1 (pre) to sample 2 (post), median (IQR) | 1.1 (1.0 to 1.8) |
| Sample 1 sNfL (pg/mL), median (IQR) | 10.1 (6.7 to 13.8) |
| Sample 1 GFAP (pg/mL), median (IQR) | 109.7 (76.4 to 146.5) |
| Sample 2 sNfL (pg/mL), median (IQR) | 10.4 (7.2 to 17.4) |
| Sample 2 GFAP (pg/mL), median (IQR) | 113.3 (83.2 to 146.1) |
| Patients with >100% increase in sNfL, N (%) | 7 (9.0) |
| Percent change in sNfL, median (IQR) | 3.7 (−23.5 to 30.9) |
| Patients with >50% increase in sGFAP, N (%) | 5 (6.4) |
| Percent change in sGFAP, median (IQR) | 1.8 (−12.9 to 28.3) |
| Outcome data | |
| Follow-up duration after treatment stop date, y | 6.3 (4.2 to 8.5) |
| Final EDSS, median (IQR) | 2.0 (1.0 to 2.5) |
| Patients with CDW, N (%) | 27 (35) |
| Years from treatment stop to CDW, median (IQR) | 5.15 (2.68 to 7.18) |
| Patients with new attack, N (%) | 19 (24) |
| Years from treatment stop to attack, median (IQR) | 3.26 (0.92 to 5.31) |
| Patients with new MRI activity, N (%) | 26 (33) |
| Years from treatment stop to MRI activity, median (IQR) | 1.99 (0.95 to 3.95) |
| Patients with any disease activity, N (%) | 40 (51) |
| Patients who restarted treatment, N (%) | 36 (46) |
Abbreviations: CDW = confirmed disability worsening; EDSS = Expanded Disability Status Scale; IQR = interquartile range; sGFAP = serum glial fibrillary acidic protein; sNfL = serum neurofilament light chain.
Data shown as median (interquartile range) or count (percent).