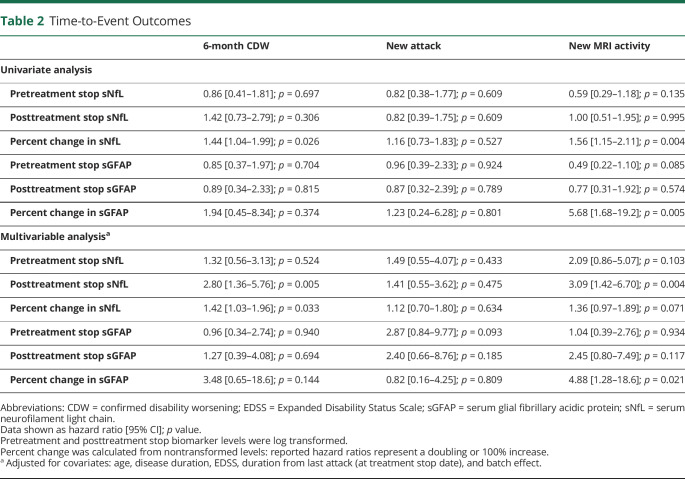
Table 2.
Time-to-Event Outcomes
| 6-month CDW | New attack | New MRI activity | |
| Univariate analysis | |||
| Pretreatment stop sNfL | 0.86 [0.41–1.81]; p = 0.697 | 0.82 [0.38–1.77]; p = 0.609 | 0.59 [0.29–1.18]; p = 0.135 |
| Posttreatment stop sNfL | 1.42 [0.73–2.79]; p = 0.306 | 0.82 [0.39–1.75]; p = 0.609 | 1.00 [0.51–1.95]; p = 0.995 |
| Percent change in sNfL | 1.44 [1.04–1.99]; p = 0.026 | 1.16 [0.73–1.83]; p = 0.527 | 1.56 [1.15–2.11]; p = 0.004 |
| Pretreatment stop sGFAP | 0.85 [0.37–1.97]; p = 0.704 | 0.96 [0.39–2.33]; p = 0.924 | 0.49 [0.22–1.10]; p = 0.085 |
| Posttreatment stop sGFAP | 0.89 [0.34–2.33]; p = 0.815 | 0.87 [0.32–2.39]; p = 0.789 | 0.77 [0.31–1.92]; p = 0.574 |
| Percent change in sGFAP | 1.94 [0.45–8.34]; p = 0.374 | 1.23 [0.24–6.28]; p = 0.801 | 5.68 [1.68–19.2]; p = 0.005 |
| Multivariable analysisa | |||
| Pretreatment stop sNfL | 1.32 [0.56–3.13]; p = 0.524 | 1.49 [0.55–4.07]; p = 0.433 | 2.09 [0.86–5.07]; p = 0.103 |
| Posttreatment stop sNfL | 2.80 [1.36–5.76]; p = 0.005 | 1.41 [0.55–3.62]; p = 0.475 | 3.09 [1.42–6.70]; p = 0.004 |
| Percent change in sNfL | 1.42 [1.03–1.96]; p = 0.033 | 1.12 [0.70–1.80]; p = 0.634 | 1.36 [0.97–1.89]; p = 0.071 |
| Pretreatment stop sGFAP | 0.96 [0.34–2.74]; p = 0.940 | 2.87 [0.84–9.77]; p = 0.093 | 1.04 [0.39–2.76]; p = 0.934 |
| Posttreatment stop sGFAP | 1.27 [0.39–4.08]; p = 0.694 | 2.40 [0.66–8.76]; p = 0.185 | 2.45 [0.80–7.49]; p = 0.117 |
| Percent change in sGFAP | 3.48 [0.65–18.6]; p = 0.144 | 0.82 [0.16–4.25]; p = 0.809 | 4.88 [1.28–18.6]; p = 0.021 |
Abbreviations: CDW = confirmed disability worsening; EDSS = Expanded Disability Status Scale; sGFAP = serum glial fibrillary acidic protein; sNfL = serum neurofilament light chain.
Data shown as hazard ratio [95% CI]; p value.
Pretreatment and posttreatment stop biomarker levels were log transformed.
Percent change was calculated from nontransformed levels: reported hazard ratios represent a doubling or 100% increase.
Adjusted for covariates: age, disease duration, EDSS, duration from last attack (at treatment stop date), and batch effect.

