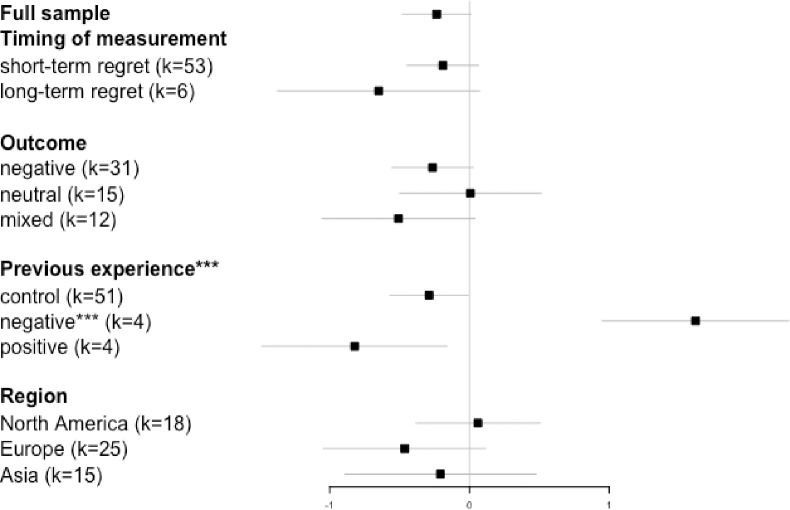
Fig 4. Forest plot with a meta-analytic mean and meta-regression model of moderators.
Note. Black squares represent the estimated effect size for each level of moderators, the error bars represent the 95% confidence intervals. The first level of each moderator is set as the baseline. A significance flag * by the moderator name refers to the whole model (Q-statistic); a significance flag by each level of a predictor refers to the difference between that level and the baseline. *** p < 0.001. The total sample size of outcome and region is 58. One study whose outcome setting was positive was not included in the moderating analysis of outcome. For one study we could not identify the region where the study was conducted.

