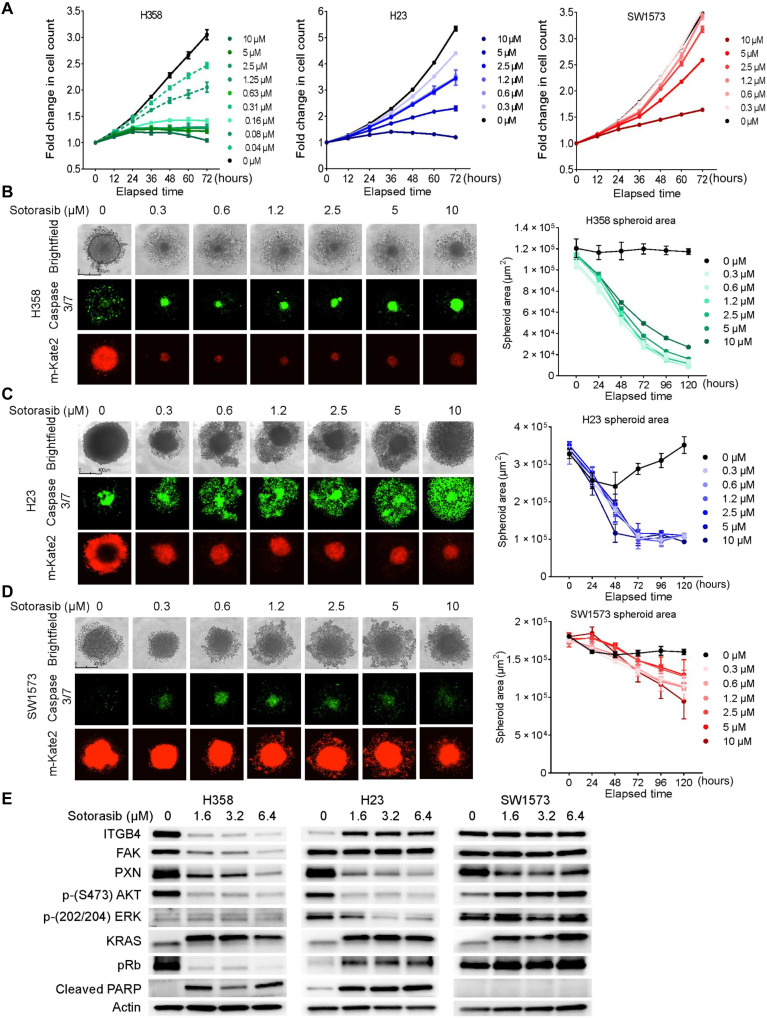
Fig. 1. NSCLC KRAS G12C cell lines respond to sotorasib at varying concentrations.
(A) NSCLC cell lines (H358, H23, and SW1573) with a KRAS G12C mutation were treated with an increasing concentration (0.3 to 10 μM) of sotorasib, and fold change in cell count was determined throughout 72 hours. Two-way ANOVA was used to calculate the statistical significance for each time point and for each drug concentration. n = 3 per group. (B) H358 cell line–derived spheroids were treated with an increasing concentration (0.3 to 10 μM) of sotorasib, and images were taken with the IncuCyte Live Cell Imaging System on day 5. Red fluorescence indicates cell viability, and green fluorescence indicates caspase 3/7 activity. The kinetics of the spheroid area was captured and plotted as graphs beside the images. Ordinary one-way analysis of variance (ANOVA) was used to calculate the statistical significance for each time point and each drug concentration. n = 4 per group. (C and D) Effect of increasing concentration of sotorasib on the H23- and SW1573-derived spheroids. Ordinary one-way ANOVA was used to calculate the statistical significance for each time point and for each drug concentration. n = 4 per group. (E) Immunoblot showing changes in the expression of KRAS and downstream signaling molecules upon sotorasib treatment (1.6, 3.2, and 6.4 μM).

