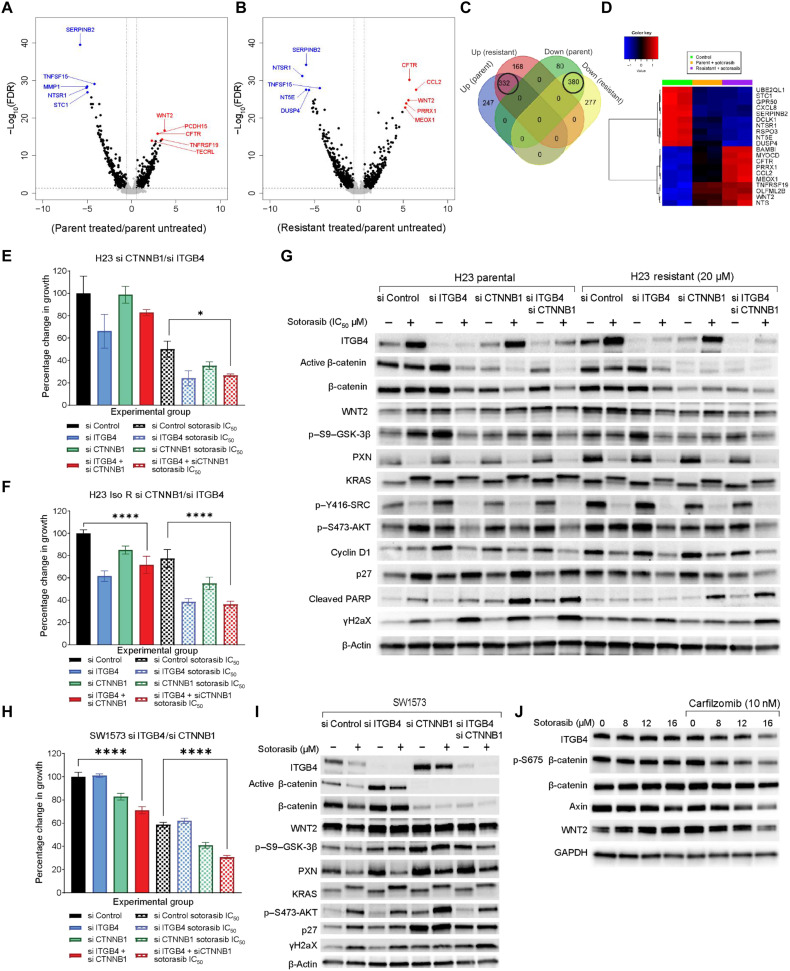
Fig. 3. RNA sequencing reveals WNT2 up-regulation upon sotorasib treatment.
Volcano plot representing gene expression changes between (A) H23 parental cells, sotorasib treated versus untreated, and (B) isogenic resistant H23 cells compared to parental cells. Statistical significance was calculated for control verse treatment. n = 3 per group. (C) Number of overlapping and unique genes that were up-regulated or down-regulated with respect to treatment represented as a Venn diagram. (D) Heatmap representing top 10 overlapping up-regulated and down-regulated genes based on average fold change. (E and F) Effect of 3.2 μM sotorasib on H23 parental or isogenic resistant (Iso R) cells having knockdown of ITGB4 or CTNNB1 or both represented as percent change in growth at 96 hours (bar graph), respectively. Two-way ANOVA was used to calculate the statistical significance for each time point and for each condition (si Control, si ITGB4, si CTNNB1, si CTNNB1 + si ITGB4; n = 3 per group; ****P < 0.0001. (G) Immunoblot confirmed knockdown of ITGB4 and β-catenin in H23 parental cells and H23 sotorasib (20 μM) resistant cells. These cells were also treated with 3.2 μM sotorasib for 72 hours to identify changes in protein expression and signaling. (H) Representing the effect of ITGB4 and CTNNB1 single knockdown or double knockdown together with 10 μM sotorasib as a percent change in growth. Two-way ANOVA was used to calculate the statistical significance for each time point and each condition (si Control, si PXN, si ITGB4, and si PXN + si ITGB4; n = 3 per group; ****P < 0.0001. (I) Immunoblot showing knockdown of ITGB4 and β-catenin and changes in expression of active β-catenin, γH2AX, and p27 in SW1573 cells. (J) Immunoblot showing the reduction in the expression of WNT2, ITGB4, phospho, and total β-catenin in the SW1573 treated with sotorasib and CFZ drug combination.

